

Association between annual visit-to-visit blood pressure variability and stroke in postmenopausal women: data from the Women's Health Initiative
- PMID: 22753206
- PMCID: PMC3427141
- DOI: 10.1161/HYPERTENSIONAHA.112.193094
Association between annual visit-to-visit blood pressure variability and stroke in postmenopausal women: data from the Women's Health Initiative
Abstract
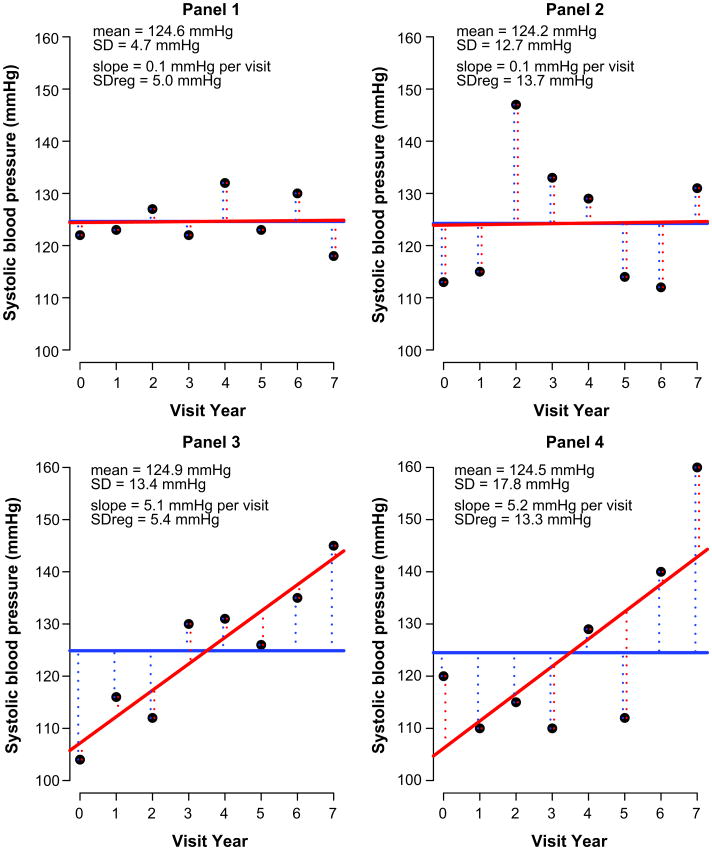
Accumulating evidence suggests that increased visit-to-visit variability (VVV) of blood pressure is associated with stroke. No study has examined the association between VVV of blood pressure and stroke in postmenopausal women, and scarce data exist as to whether this relation is independent of the temporal trend of blood pressure. We examined the association of VVV of blood pressure with stroke in 58,228 postmenopausal women enrolled in the Women's Health Initiative. Duplicate blood pressure readings, which were averaged, were taken at baseline and at each annual visit. VVV was defined as the SD for the participant's mean systolic blood pressure (SBP) across visits (SD) and about the participant's regression line with SBP regressed across visits (SDreg). Over a median follow-up of 5.4 years, 997 strokes occurred. In an adjusted model including mean SBP over time, the hazard ratios (95% CI) of stroke for higher quartiles of SD of SBP compared with the lowest quartile (referent) were 1.39 (1.03-1.89) for quartile 2, 1.52 (1.13-2.03) for quartile 3, and 1.72 (1.28-2.32) for quartile 4 (P trend <0.001). The relation was similar for SDreg of SBP quartiles in a model that additionally adjusted for the temporal trend in SBP (P trend <0.001). The associations did not differ by stroke type (ischemic versus hemorrhagic). There was a significant interaction between mean SBP and SDreg on stroke with the strongest association seen below 120 mmHg. In postmenopausal women, greater VVV of SBP was associated with increased risk of stroke, particularly in the lowest range of mean SBP.
Conflict of interest statement
Anthony Bavry is a consultant for the American College of Cardiology's Cardiosource, and has received research funding from Novartis. There are no other potential conflicts of interest.
Figures
References
-
- Kochanek MA, Xu J, Murphy SL, Minino AM, Kung HC. Deaths: Preliminary data for 2009. Natl Vital Stat Rep. 2011;49:1–51. - PubMed
-
- Roger VL, Go AS, Lloyd-Jones DM, Adams RJ, Berry JD, Brown TM, Carnethon MR, Dai S, de Simone G, Ford ES, Fox CS, Fullerton HJ, Gillespie C, Greenlund KJ, Hailpern SM, Heit JA, Ho PM, Howard VJ, Kissela BM, Kittner SJ, Lackland DT, Lichtman JH, Lisabeth LD, Makuc DM, Marcus GM, Marelli A, Matchar DB, McDermott MM, Meigs JB, Moy CS, Mozaffarian D, Mussolino ME, Nichol G, Paynter NP, Rosamond WD, Sorlie PD, Stafford RS, Turan TN, Turner MB, Wong ND, Wylie-Rosett J, Roger VL, Turner MB, Wong ND, Wylie-Rosett J. Heart disease and stroke statistics--2011 update: A report from the american heart association. Circulation. 2011;123:e18–e209. - PMC - PubMed
-
- Lewington S, Clarke R, Qizilbash N, Peto R, Collins R. Age-specific relevance of usual blood pressure to vascular mortality: A meta-analysis of individual data for one million adults in 61 prospective studies. The Lancet. 2002;360:1903–1913. - PubMed
-
- Pickering TG, Hall JE, Appel LJ, Falkner BE, Graves J, Hill MN, Jones DW, Kurtz T, Sheps SG, Roccella EJ. Recommendations for blood pressure measurement in humans and experimental animals: Part 1: Blood pressure measurement in humans: A statement for professionals from the subcommittee of professional and public education of the american heart association council on high blood pressure research. Hypertension. 2005;45:142–161. - PubMed
-
- Clarke R, Shipley M, Lewington S, Youngman L, Collins R, Marmot M, Peto R. Underestimation of risk associations due to regression dilution in long-term follow-up of prospective studies. American journal of epidemiology. 1999;150:341–353. - PubMed
Publication types
MeSH terms
Grants and funding
- N01 WH032112/WH/WHI NIH HHS/United States
- UL1 TR000064/TR/NCATS NIH HHS/United States
- N01 WH042107/WH/WHI NIH HHS/United States
- N01 WH032109/WH/WHI NIH HHS/United States
- N01WH32100-2/WH/WHI NIH HHS/United States
- N01WH32108-9/WH/WHI NIH HHS/United States
- N01WH42107-26/WH/WHI NIH HHS/United States
- N01WH32105-6/WH/WHI NIH HHS/United States
- N01WH32111-13/WH/WHI NIH HHS/United States
- N01WH32118-32119/WH/WHI NIH HHS/United States
- N01 WH032105/HL/NHLBI NIH HHS/United States
- N01 WH032113/WH/WHI NIH HHS/United States
- N01 WH044221/WH/WHI NIH HHS/United States
- N01 WH032101/WH/WHI NIH HHS/United States
- N01WH42129-32/WH/WHI NIH HHS/United States
- N01 WH042131/HL/NHLBI NIH HHS/United States
- N01 WH022110/WH/WHI NIH HHS/United States
- N01 WH032100/WH/WHI NIH HHS/United States
- N01 WH032111/WH/WHI NIH HHS/United States
- N01 WH032122/WH/WHI NIH HHS/United States
- N01 WH032118/WH/WHI NIH HHS/United States
- N01 WH042130/WH/WHI NIH HHS/United States
- N01 WH032106/WH/WHI NIH HHS/United States
- N01 WH042132/WH/WHI NIH HHS/United States
- N01 WH032115/WH/WHI NIH HHS/United States
- N01 WH032108/WH/WHI NIH HHS/United States
- N01 WH032102/WH/WHI NIH HHS/United States
- N01WH32115/WH/WHI NIH HHS/United States
- N01 WH032119/WH/WHI NIH HHS/United States
- N01 WH042129/WH/WHI NIH HHS/United States
- N01 WH024152/WH/WHI NIH HHS/United States
LinkOut - more resources
Full Text Sources
Medical
