

Thoracic aortic aneurysm (TAAD)-causing mutation in actin affects formin regulation of polymerization
- PMID: 22753406
- PMCID: PMC3436569
- DOI: 10.1074/jbc.M112.371914
Thoracic aortic aneurysm (TAAD)-causing mutation in actin affects formin regulation of polymerization
Abstract
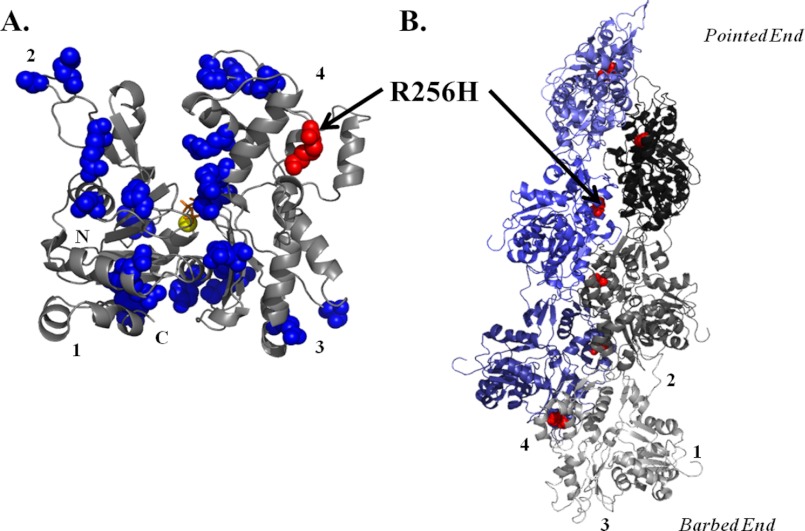
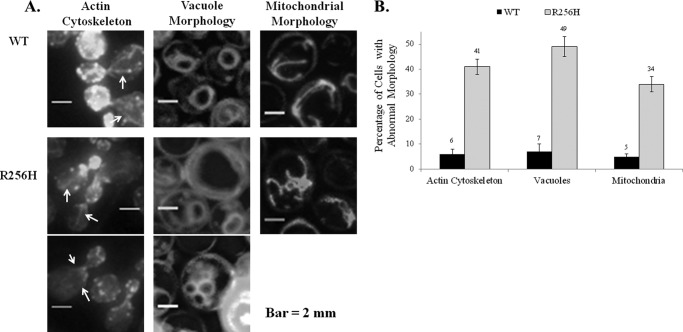
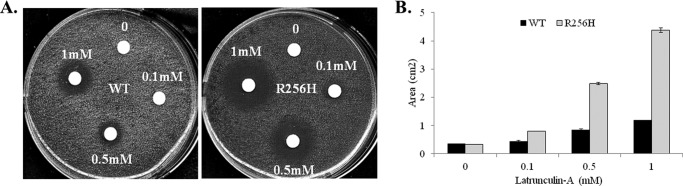
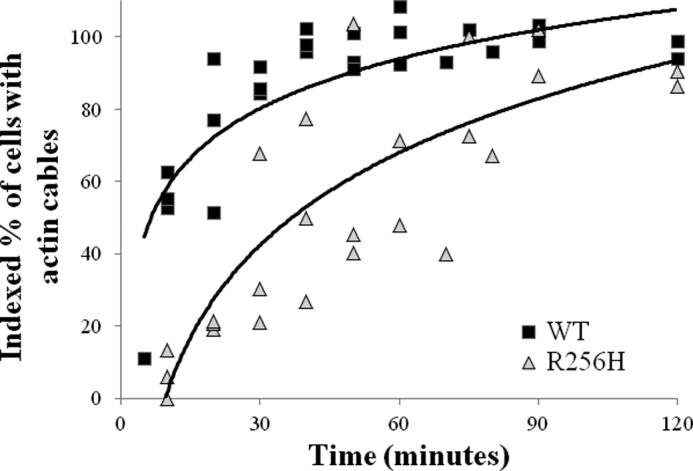
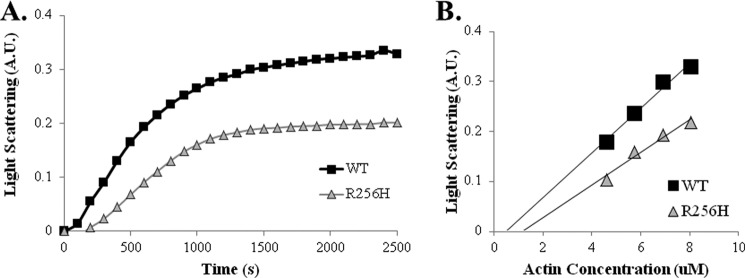
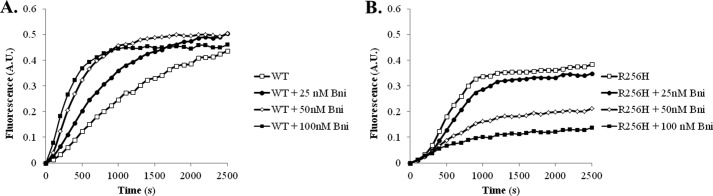
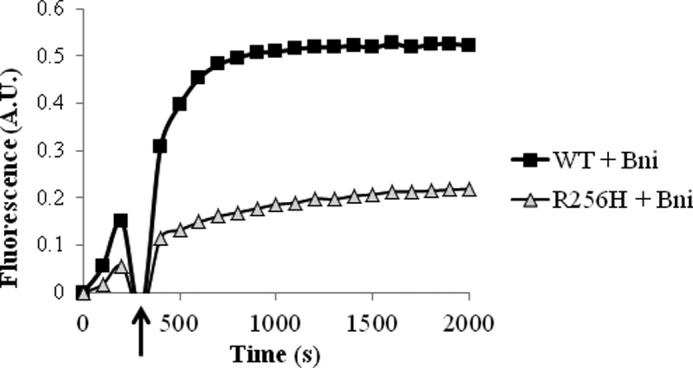
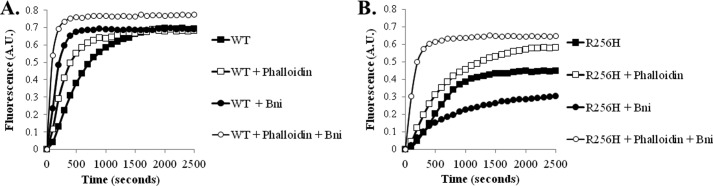
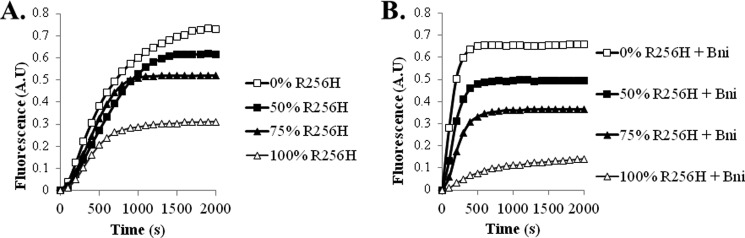
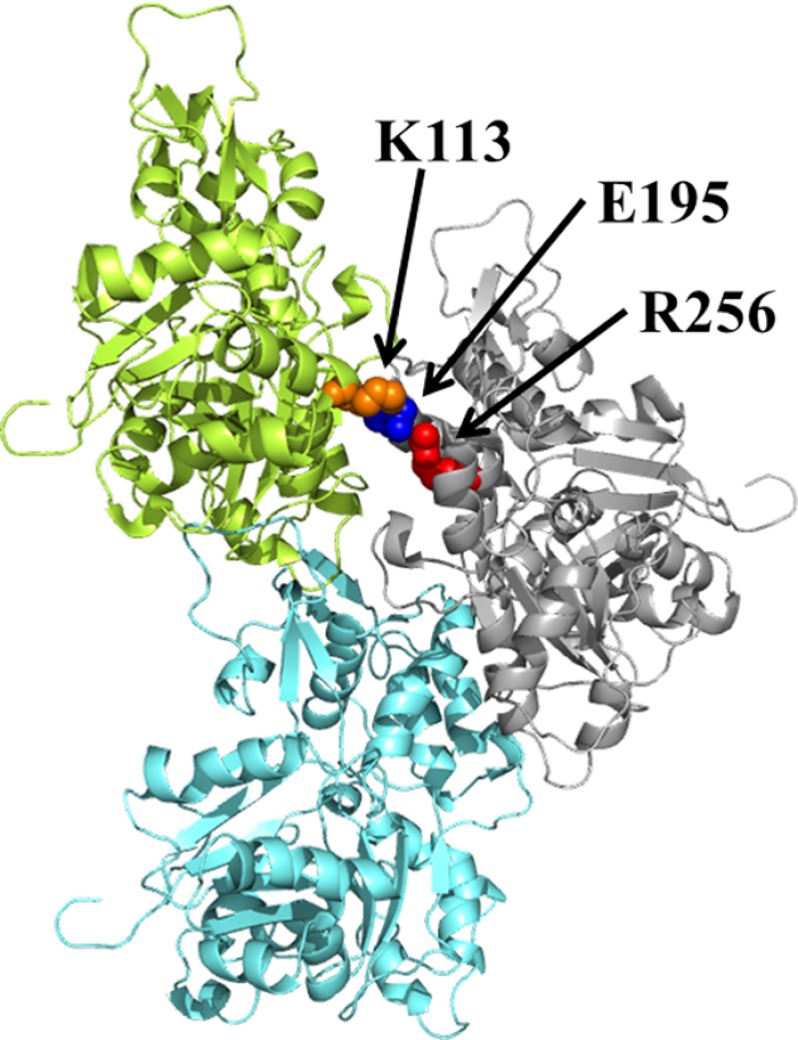
More than 30 mutations in ACTA2, which encodes α-smooth muscle actin, have been identified to cause autosomal dominant thoracic aortic aneurysm and dissection. The mutation R256H is of particular interest because it also causes patent ductus arteriosus and moyamoya disease. R256H is one of the more prevalent mutations and, based on its molecular location near the strand-strand interface in the actin filament, may affect F-actin stability. To understand the molecular ramifications of the R256H mutation, we generated Saccharomyces cerevisiae yeast cells expressing only R256H yeast actin as a model system. These cells displayed abnormal cytoskeletal morphology and increased sensitivity to latrunculin A. After cable disassembly induced by transient exposure to latrunculin A, mutant cells were delayed in reestablishing the actin cytoskeleton. In vitro, mutant actin exhibited a higher than normal critical concentration and a delayed nucleation. Consequently, we investigated regulation of mutant actin by formin, a potent facilitator of nucleation and a protein needed for normal vascular smooth muscle cell development. Mutant actin polymerization was inhibited by the FH1-FH2 fragment of the yeast formin, Bni1. This fragment strongly capped the filament rather than facilitating polymerization. Interestingly, phalloidin or the presence of wild type actin reversed the strong capping behavior of Bni1. Together, the data suggest that the R256H actin mutation alters filament conformation resulting in filament instability and misregulation by formin. These biochemical effects may contribute to abnormal histology identified in diseased arterial samples from affected patients.
Figures
Similar articles
-
Importance of a Lys113-Glu195 intermonomer ionic bond in F-actin stabilization and regulation by yeast formins Bni1p and Bnr1p.J Biol Chem. 2013 Jun 28;288(26):19140-53. doi: 10.1074/jbc.M113.474122. Epub 2013 May 7. J Biol Chem. 2013. PMID: 23653364 Free PMC article.
-
Differential regulation of actin polymerization and structure by yeast formin isoforms.J Biol Chem. 2009 Jun 19;284(25):16776-16783. doi: 10.1074/jbc.M109.006981. Epub 2009 Apr 22. J Biol Chem. 2009. PMID: 19386598 Free PMC article.
-
Control of Formin Distribution and Actin Cable Assembly by the E3 Ubiquitin Ligases Dma1 and Dma2.Genetics. 2016 Sep;204(1):205-20. doi: 10.1534/genetics.116.189258. Epub 2016 Jul 22. Genetics. 2016. PMID: 27449057 Free PMC article.
-
Mechanostress resistance involving formin homology proteins: G- and F-actin homeostasis-driven filament nucleation and helical polymerization-mediated actin polymer stabilization.Biochem Biophys Res Commun. 2018 Nov 25;506(2):323-329. doi: 10.1016/j.bbrc.2018.09.189. Epub 2018 Oct 9. Biochem Biophys Res Commun. 2018. PMID: 30309655 Review.
-
Specification of Architecture and Function of Actin Structures by Actin Nucleation Factors.Annu Rev Biophys. 2015;44:285-310. doi: 10.1146/annurev-biophys-060414-034308. Annu Rev Biophys. 2015. PMID: 26098516 Free PMC article. Review.
Cited by
-
Mutant vascular actin is a TAAD misbehaving.Proc Natl Acad Sci U S A. 2015 Aug 4;112(31):9500-1. doi: 10.1073/pnas.1512086112. Epub 2015 Jul 23. Proc Natl Acad Sci U S A. 2015. PMID: 26204915 Free PMC article. No abstract available.
-
Whole-Exome Sequencing Identified Genes Responsible for Thoracic Aortic Aneurysms and Dissections in three Chinese Families.Front Genet. 2022 Jun 8;13:910932. doi: 10.3389/fgene.2022.910932. eCollection 2022. Front Genet. 2022. PMID: 35754816 Free PMC article.
-
The role of vascular smooth muscle cells in the development of aortic aneurysms and dissections.Eur J Clin Invest. 2022 Apr;52(4):e13697. doi: 10.1111/eci.13697. Epub 2021 Nov 21. Eur J Clin Invest. 2022. PMID: 34698377 Free PMC article. Review.
-
Importance of a Lys113-Glu195 intermonomer ionic bond in F-actin stabilization and regulation by yeast formins Bni1p and Bnr1p.J Biol Chem. 2013 Jun 28;288(26):19140-53. doi: 10.1074/jbc.M113.474122. Epub 2013 May 7. J Biol Chem. 2013. PMID: 23653364 Free PMC article.
-
The prefoldin complex regulates chromatin dynamics during transcription elongation.PLoS Genet. 2013;9(9):e1003776. doi: 10.1371/journal.pgen.1003776. Epub 2013 Sep 19. PLoS Genet. 2013. PMID: 24068951 Free PMC article.
References
-
- Guo D. C., Pannu H., Tran-Fadulu V., Papke C. L., Yu R. K., Avidan N., Bourgeois S., Estrera A. L., Safi H. J., Sparks E., Amor D., Ades L., McConnell V., Willoughby C. E., Abuelo D., Willing M., Lewis R. A., Kim D. H., Scherer S., Tung P. P., Ahn C., Buja L. M., Raman C. S., Shete S. S., Milewicz D. M. (2007) Mutations in smooth muscle α-actin (ACTA2) lead to thoracic aortic aneurysms and dissections. Nat. Genet. 39, 1488–1493 - PubMed
-
- Guo D. C., Papke C. L., Tran-Fadulu V., Regalado E. S., Avidan N., Johnson R. J., Kim D. H., Pannu H., Willing M. C., Sparks E., Pyeritz R. E., Singh M. N., Dalman R. L., Grotta J. C., Marian A. J., Boerwinkle E. A., Frazier L. Q., LeMaire S. A., Coselli J. S., Estrera A. L., Safi H. J., Veeraraghavan S., Muzny D. M., Wheeler D. A., Willerson J. T., Yu R. K., Shete S. S., Scherer S. E., Raman C. S., Buja L. M., Milewicz D. M. (2009) Mutations in smooth muscle α-actin (ACTA2) cause coronary artery disease, stroke, and Moyamoya disease, along with thoracic aortic disease. Am. J. Hum. Genet. 84, 617–627 - PMC - PubMed
-
- Morisaki H., Akutsu K., Ogino H., Kondo N., Yamanaka I., Tsutsumi Y., Yoshimuta T., Okajima T., Matsuda H., Minatoya K., Sasaki H., Tanaka H., Ishibashi-Ueda H., Morisaki T. (2009) Mutation of ACTA2 gene as an important cause of familial and nonfamilial nonsyndromatic thoracic aortic aneurysm and/or dissection (TAAD). Hum. Mutat. 30, 1406–1411 - PubMed
-
- Yoo E. H., Choi S. H., Jang S. Y., Suh Y. L., Lee I., Song J. K., Choe Y. H., Kim J. W., Ki C. S., Kim D. K. (2010) Clinical, pathological, and genetic analysis of a Korean family with thoracic aortic aneurysms and dissections carrying a novel D26Y mutation. Ann. Clin. Lab. Sci. 40, 278–284 - PubMed
Publication types
MeSH terms
Substances
Grants and funding
LinkOut - more resources
Full Text Sources
Medical
Molecular Biology Databases
Miscellaneous
