. 2012 Aug 24;287(35):29529-42.
doi: 10.1074/jbc.M111.338012. Epub 2012 Jun 29.

Suppression of nuclear factor-κB activation and inflammation in microglia by physically modified saline

Affiliations

Suppression of nuclear factor-κB activation and inflammation in microglia by physically modified saline

Saurabh Khasnavis et al. J Biol Chem. .

Abstract

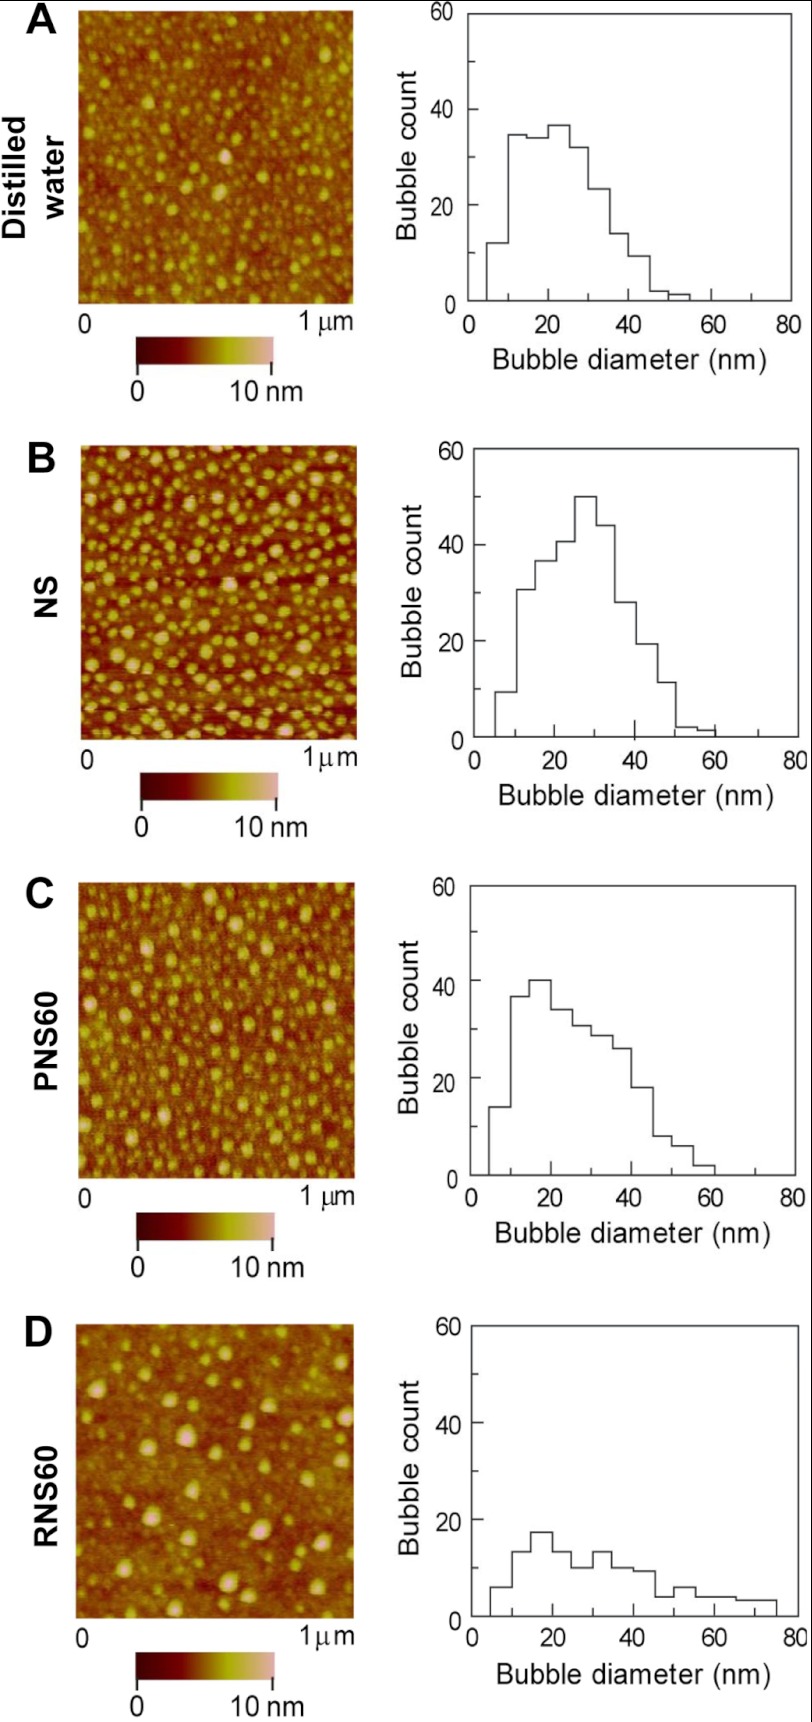
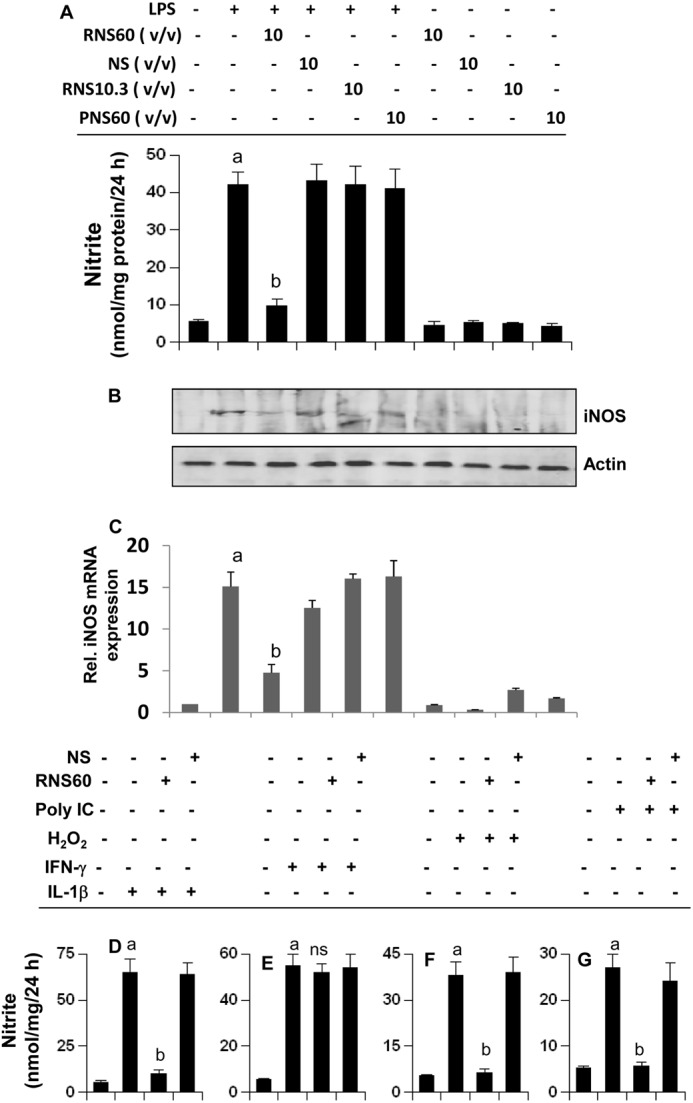
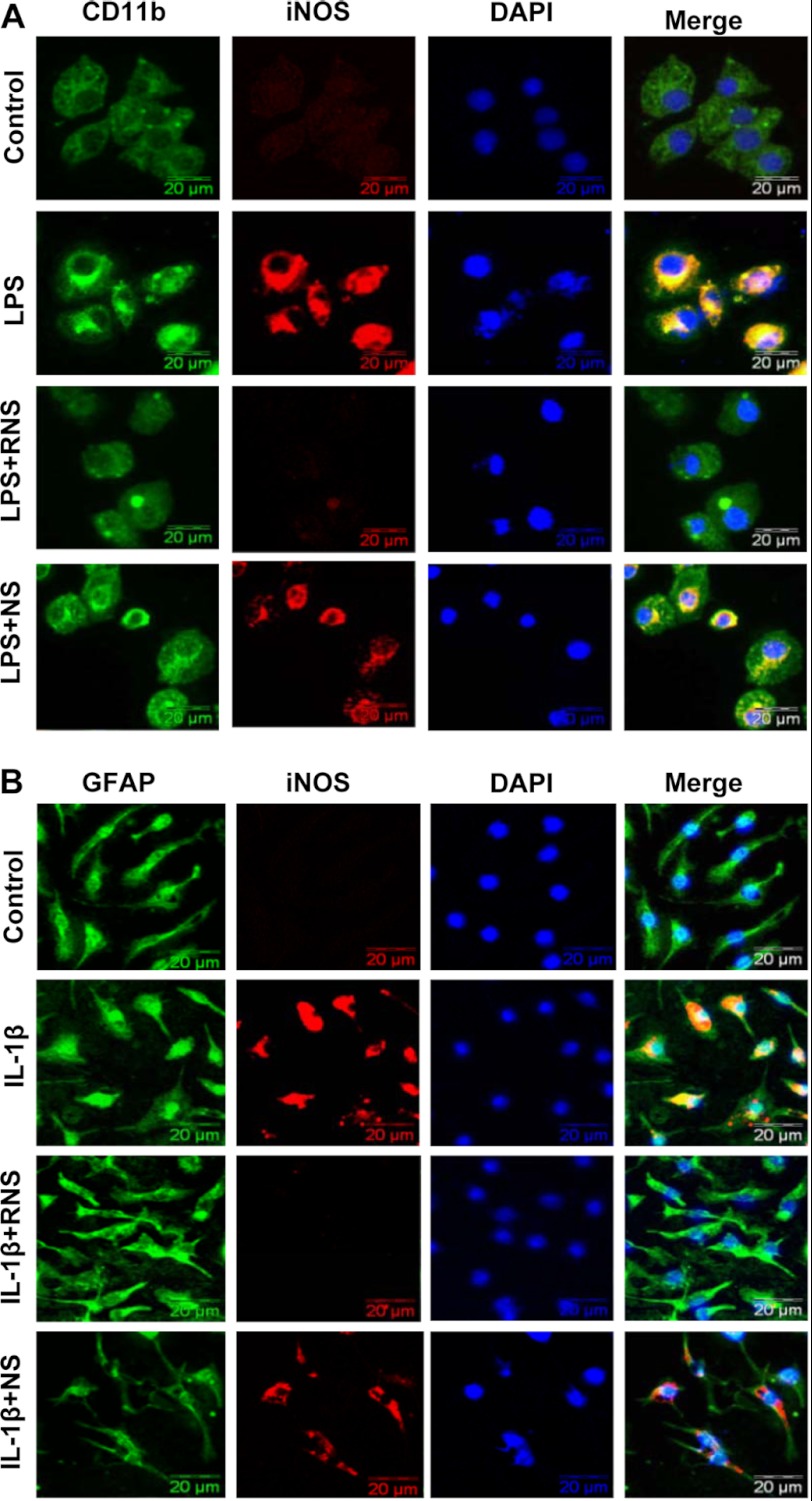
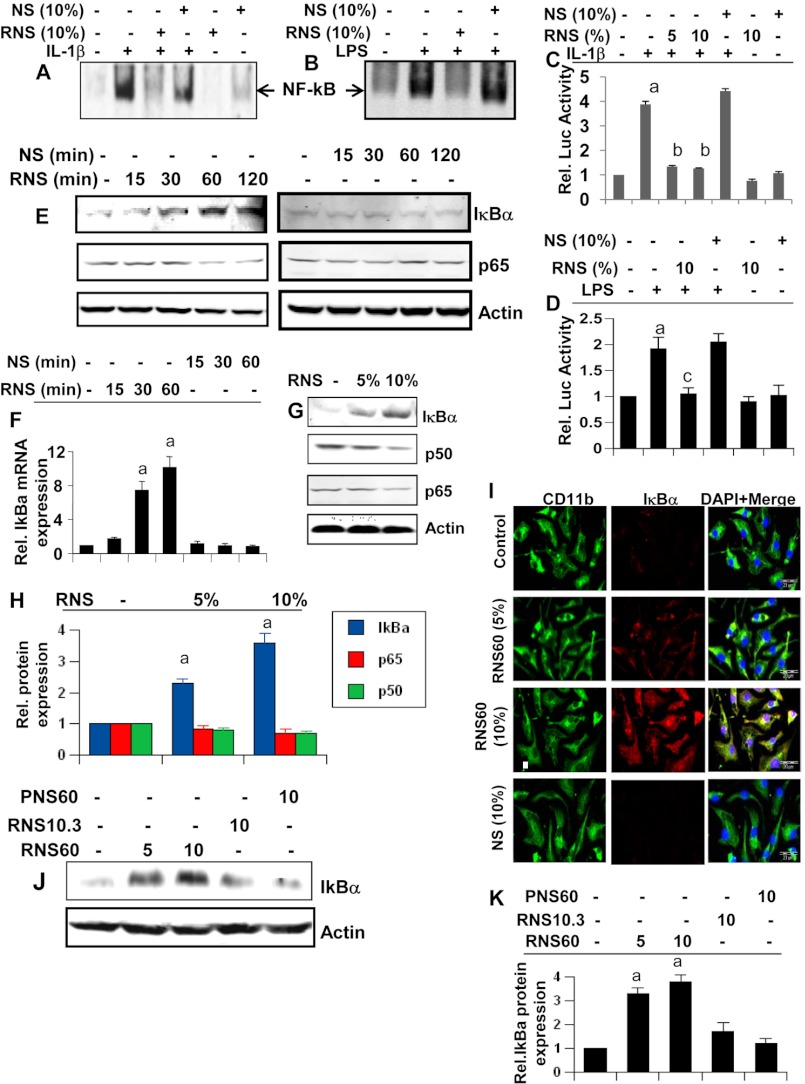
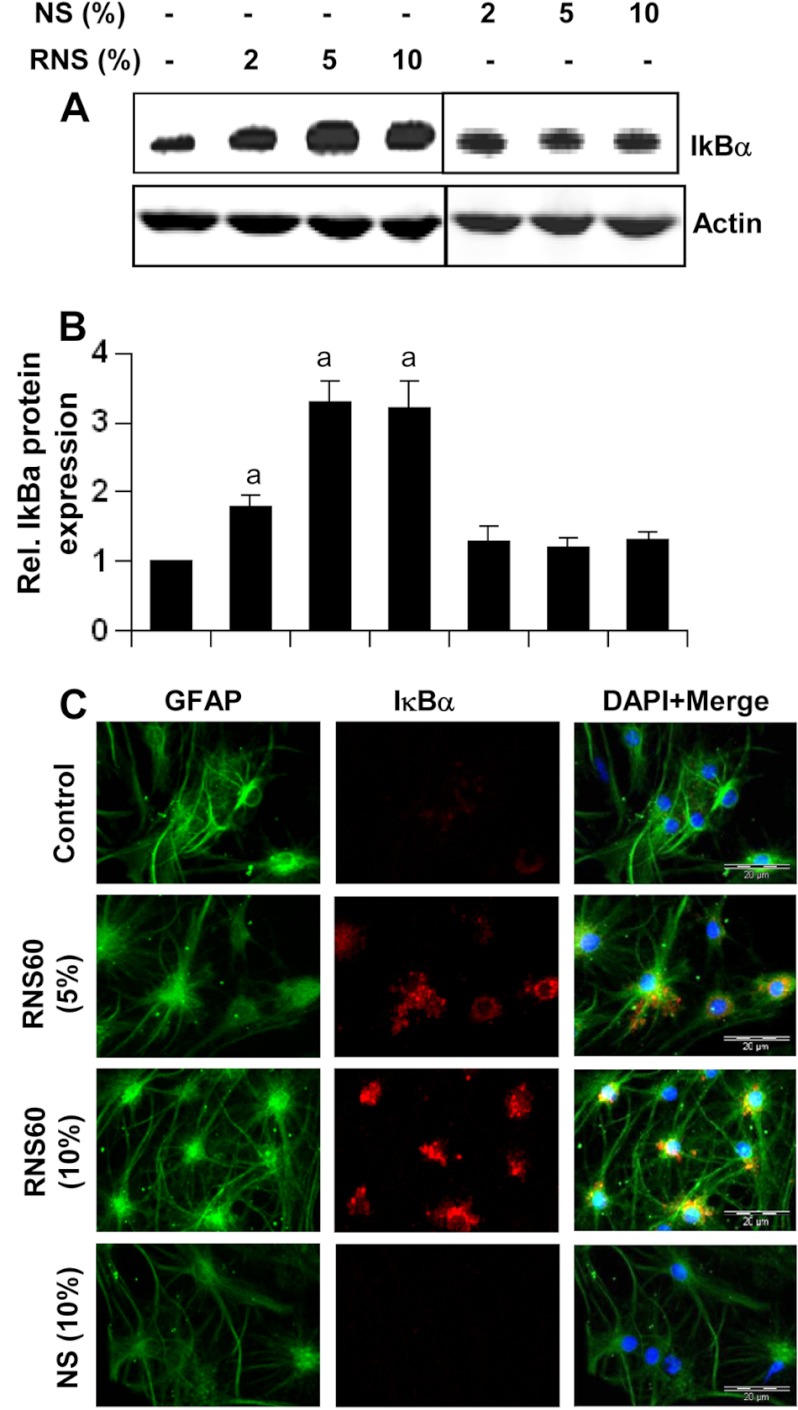
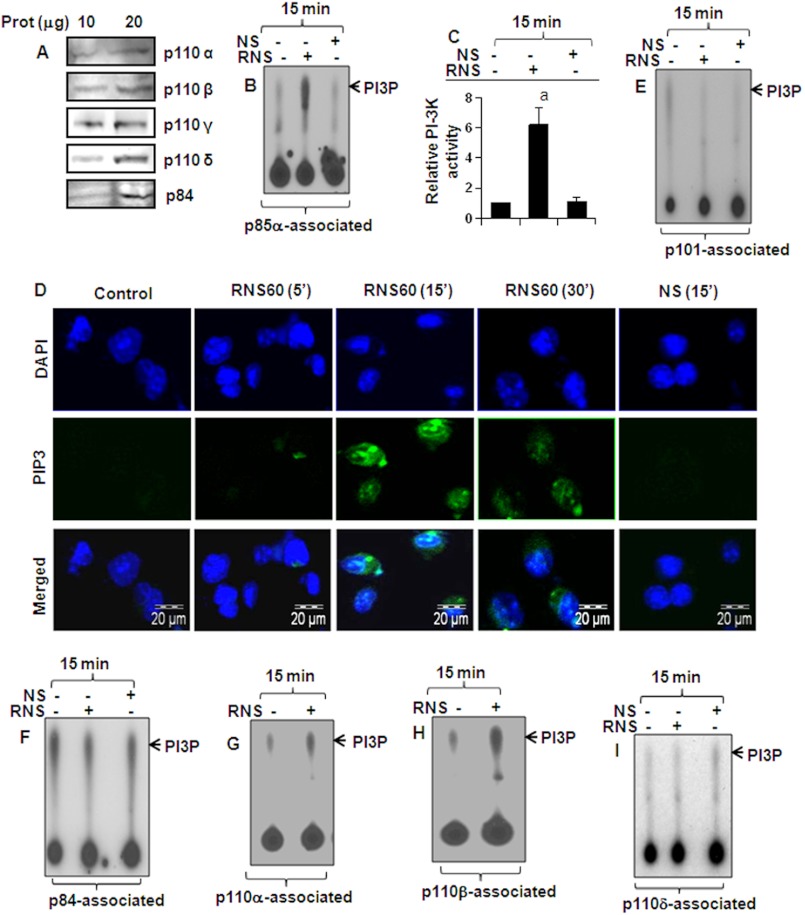
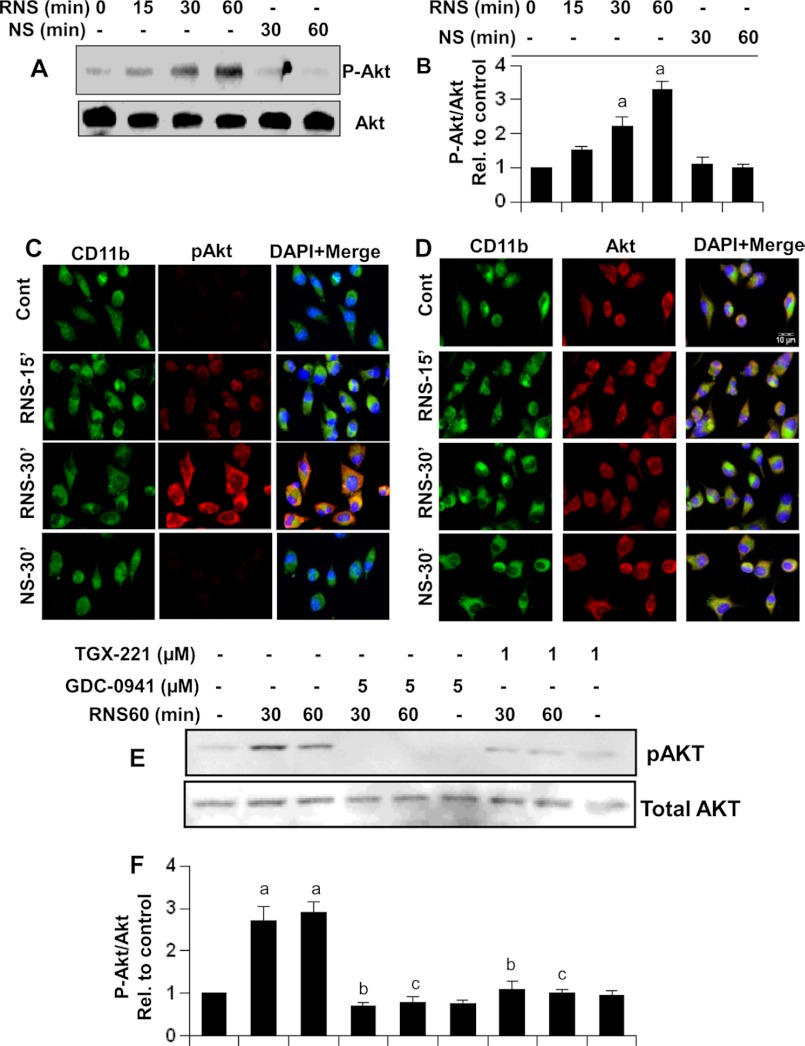
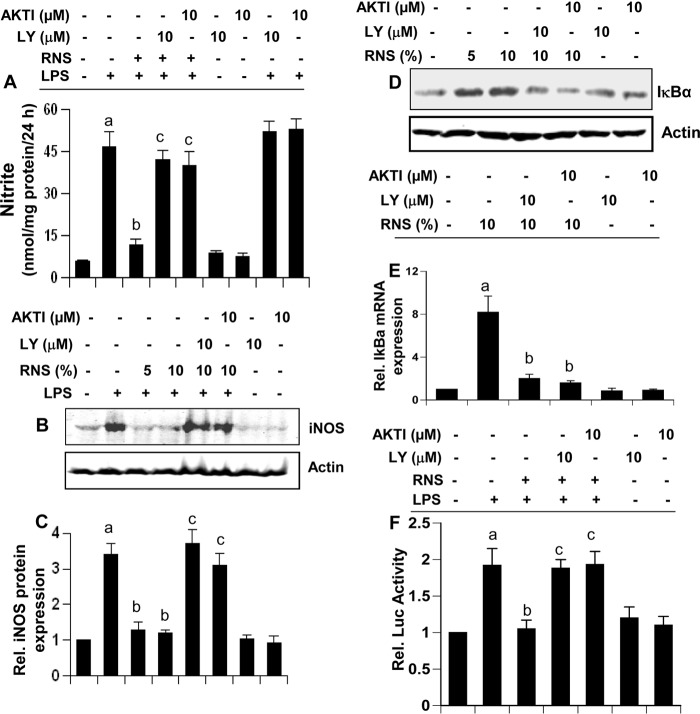
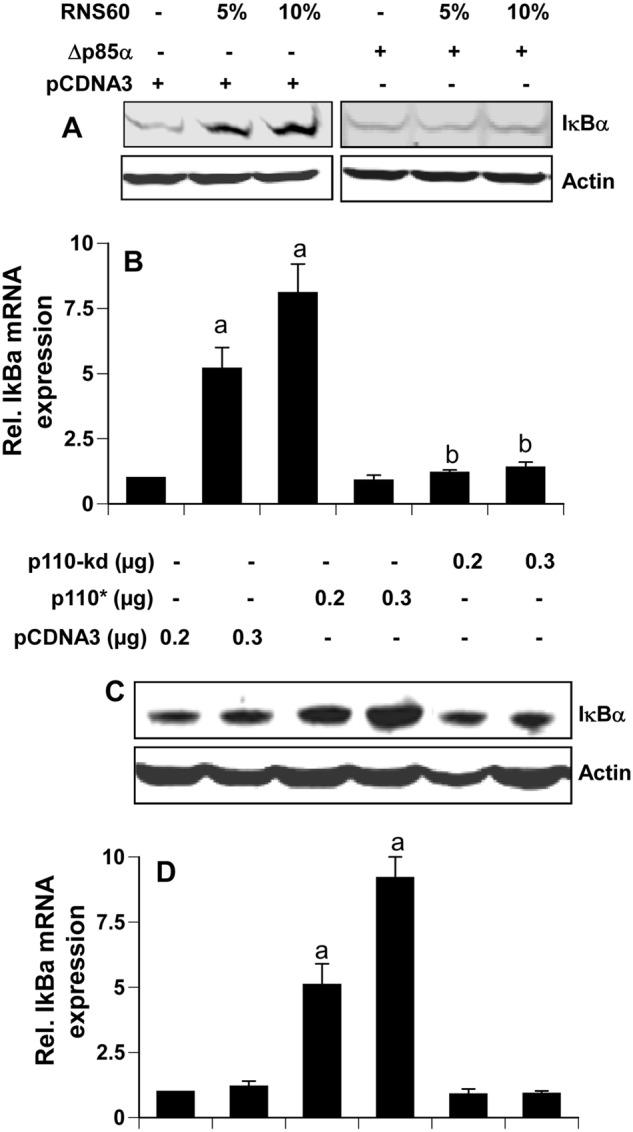
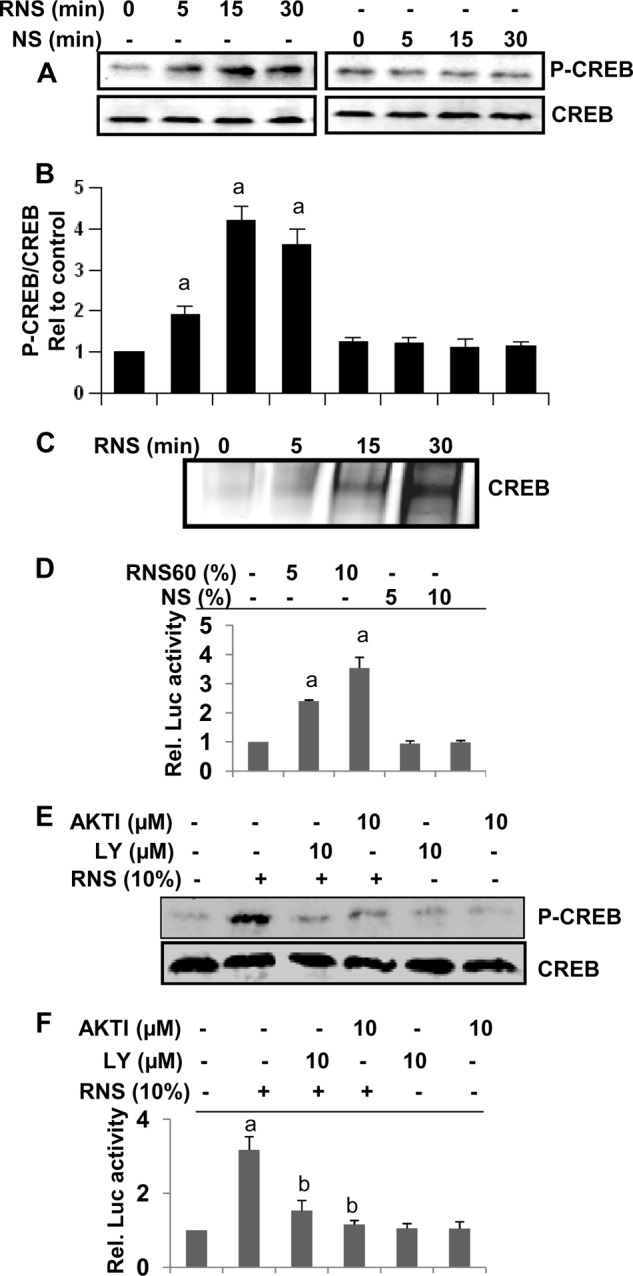
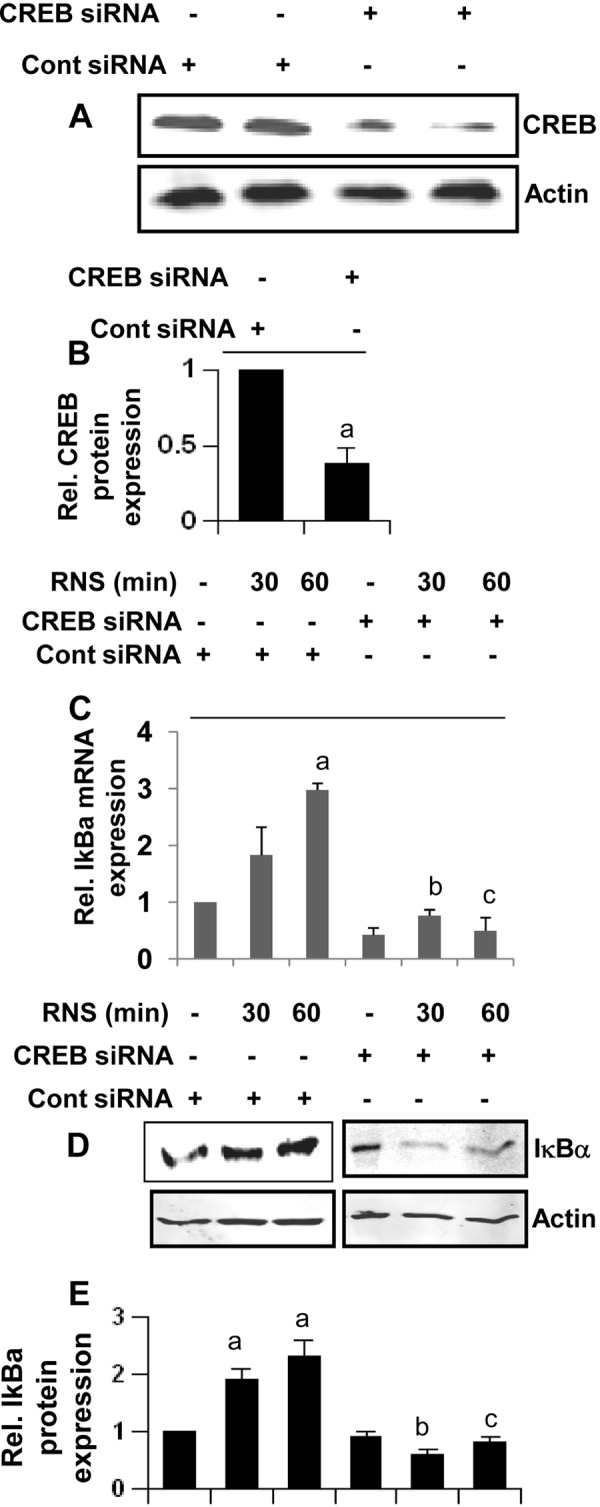
Chronic inflammation involving activated microglia and astroglia is becoming a hallmark of many human diseases, including neurodegenerative disorders. Although NF-κB is a multifunctional transcription factor, it is an important target for controlling inflammation as the transcription of many proinflammatory molecules depends on the activation of NF-κB. Here, we have undertaken a novel approach to attenuate NF-κB activation and associated inflammation in activated glial cells. RNS60 is a 0.9% saline solution containing charge-stabilized nanostructures that are generated by subjecting normal saline to Taylor-Couette-Poiseuille (TCP) flow under elevated oxygen pressure. RNS60, but not normal saline, RNS10.3 (TCP-modified saline without excess oxygen), and PNS60 (saline containing excess oxygen without TCP modification) were found to inhibit the production of nitric oxide (NO) and the expression of inducible NO synthase in activated microglia. Similarly, RNS60 also inhibited the expression of inducible NO synthase in activated astroglia. Inhibition of NF-κB activation by RNS60 suggests that RNS60 exerts its anti-inflammatory effect through the inhibition of NF-κB. Interestingly, RNS60 induced the activation of type IA phosphatidylinositol (PI) 3-kinase and Akt and rapidly up-regulated IκBα, a specific endogenous inhibitor of NF-κB. Inhibition of PI 3-kinase and Akt by either chemical inhibitors or dominant-negative mutants abrogated the RNS60-mediated up-regulation of IκBα. Furthermore, we demonstrate that RNS60 induced the activation of cAMP-response element-binding protein (CREB) via the PI 3-kinase-Akt pathway and that RNS60 up-regulated IκBα via CREB. These results describe a novel anti-inflammatory property of RNS60 via type IA PI 3-kinase-Akt-CREB-mediated up-regulation of IκBα, which may be of therapeutic benefit in neurodegenerative disorders.


Figures

FIGURE 1.
FIGURE 1.
RNS60-derived nanobubbles on polystyrene film show distinct differences from control solutions. Nanobubbles were formed on polystyrene film in distilled water (A), isotonic saline NS (B), PNS60 (C), and RNS60 (D). AFM images obtained after 15 scanning cycles are essentially identical to images generated after 2 h of scanning (data not shown), demonstrating that there are no time- and scan load-dependent artifacts.
FIGURE 2.
FIGURE 2.
RNS60 inhibits the production of NO and the expression of iNOS in activated mouse BV-2 microglial cells. A, microglial cells preincubated with RNS60, NS, RNS10.3, or PNS60 in serum-free media for 1 h were stimulated with LPS (1 μg/ml). After 24 h of stimulation, concentration of nitrite was measured in supernatant by “Griess” reagent (A), and the level of iNOS protein was monitored in cells by Western blot (B). After 6 h of stimulation, total RNA was isolated, and the mRNA expression of iNOS was analyzed by quantitative real time PCR (C). Data are mean ± S.D. of three different experiments. a, p < 0.001 versus control; b, p < 0.001 versus LPS. Cells preincubated with 10% (v/v) RNS60 or NS for 1 h were stimulated with 50 ng/ml IL-1β (D), 25 milliunits/ml IFN-γ (E), 200 μm H2O2 (F), and 100 μg/ml poly(IC) (G). After 24 h of stimulation, concentration of nitrite was measured in supernatants. Data are mean ± S.D. of three different experiments. a, p < 0.001 versus control; a, p < 0.001 versus stimuli.
FIGURE 3.
FIGURE 3.
RNS60 inhibits the expression of iNOS protein in primary mouse microglia and astroglia. A, primary mouse microglia preincubated with RNS60 or NS (10% v/v) in serum-free media for 1 h were stimulated with 1 μg/ml LPS. After 18 h of stimulation, the level of iNOS was monitored by double-label immunofluorescence using CD11b as a microglial marker. B, primary mouse astroglia preincubated with RNS60 or NS (10% v/v) in serum-free media for 1 h were stimulated with 20 ng/ml IL-1β. After 18 h of stimulation, the level of iNOS was monitored by double-label immunofluorescence using GFAP as an astroglial marker. Results represent three independent experiments.
FIGURE 4.
FIGURE 4.
RNS60 attenuates activation of NF-κB and up-regulates IκBα in mouse microglia. A, BV-2 microglial cells were treated with RNS60 or NS for 1 h followed by stimulation with 20 ng/ml IL-1β (A) or 1 μg/ml LPS (B) under serum-free conditions. After 30 min of stimulation, the DNA binding activity of NF-κB was monitored. BV-2 cells plated in 12-well plates were co-transfected with 0.25 μg of PBIIX-Luc (an NF-κB-dependent reporter construct) and 12.5 ng of pRL-TK. Twenty four hours after transfection, cells received different concentrations of RNS60 or NS. After 2 h of incubation, cells were stimulated with IL-1β (C) or LPS (D) for 4 h under serum-free conditions. Firefly and Renilla luciferase activities were obtained by analyzing the total cell extract. Results are mean ± S.D. of three different experiments. Rel Luc, relative luciferase. a, p < 0.001 versus control; b, p < 0.001 versus IL-1β; c, p < 0.001 versus LPS. BV-2 cells were treated with RNS60 or NS (10% v/v) under serum-free conditions for different minute intervals followed by monitoring protein levels of IκBα and p65 by Western blot (E) and mRNA levels of IκBα by real time PCR (F). a, p < 0.001 versus control. G, BV-2 cells were treated with different concentrations of RNS60 for 1 h followed by monitoring protein levels of IκBα, p65, and p50 by Western blot. Actin was run as a loading control. H, bands were scanned and results presented as protein expression relative to actin. a, p < 0.001 versus control. I, primary mouse microglia were treated with RNS60 or NS for 1 h followed by monitoring IκBα protein by double-label immunofluorescence using CD11b as a marker for microglia. J, BV-2 cells were treated with 10% (v/v) RNS60, RNS10.3, or PNS60 for 1 h followed by monitoring the protein level of IκBα by Western blot. K, bands were scanned, and results are presented as protein expression relative to actin. a, p < 0.001 versus control.
FIGURE 5.
FIGURE 5.
RNS60 up-regulates IκBα in mouse astroglia. A, primary mouse astroglia were treated with different concentrations of RNS60 or NS for 1 h followed by monitoring the level of IκBα protein by Western blot. Rel., relative. B, bands were scanned, and results are presented as protein expression relative to actin. a, p < 0.001 versus control. C, astroglia were treated with RNS60 or NS for 1 h followed by monitoring IκBα protein by double-label immunofluorescence using GFAP as a marker for astroglia. Results represent three independent experiments.
FIGURE 6.
FIGURE 6.
Activation of PI 3-kinase by RNS60 in mouse microglial cells. A, presence of different subunits of PI 3-kinase (p110α, p110β, p110δ, p110γ, and p84) was examined in BV-2 cells by Western blot. BV-2 microglial cells were treated with either 10% (v/v) RNS60 or NS in serum-free DMEM/F-12. After 15 min of treatment, cells were lysed, immunoprecipitated with antibodies against either p85α (B and C), p101 (E), or p84 (F), and the lipid kinase activity of immunoprecipitated PI 3-kinase was assayed. Lipids were detected by exposure to film at −70 °C (B, E, and F) and quantitated by densitometry (C). Results represent mean ± S.D. of three separate experiments. a, p < 0.001 versus control. D, cells were treated with RNS60 or NS and at different time points, and the level of PIP3 was monitored by immunofluorescence. DAPI was used to visualize nucleus. Cells were treated with RNS60 for 15 min, and cell lysates were immunoprecipitated with antibodies against p110α (G), p110β (H), or p110δ (I) followed by assaying PI 3-kinase activity in immunoprecipitates. Results represent three independent experiments.
FIGURE 7.
FIGURE 7.
RNS60 induces the activation of Akt in mouse microglial cells via PI 3-kinase. A, cells were stimulated with RNS60 or NS for different time periods followed by monitoring the levels of phospho-Akt and total Akt by Western blot. B, bands were scanned, and results are presented as phospho-Akt/total Akt. Results represent means ± S.D. of three separate experiments. a, p < 0.001 versus control. Levels of phospho-Akt (C) and total Akt (D) were also monitored by double-label immunofluorescence (C and D). E, cells preincubated with TGX-221 and GDC-0941 for 30 min were stimulated with RNS60 followed by monitoring the levels of phospho-Akt and total Akt by Western blot. F, bands were scanned and results presented as phospho-Akt/total Akt. Rel., relative. a, p < 0.001 versus control.
FIGURE 8.
FIGURE 8.
Inhibitors of PI 3-kinase-Akt pathway abrogate the anti-inflammatory effect of RNS60. Mouse BV-2 microglial cells preincubated with LY294002 (LY) (10 μm) or AktI (10 μm) for 30 min were treated with RNS60 (10% v/v) under serum-free conditions. After 1 h of treatment, cells were stimulated with 1 μg/ml LPS and 24 h after stimulation, and nitrite levels were assayed in supernatants by Griess reagent (A), and the level of iNOS protein was monitored by Western blot (B). Bands were scanned, and results are presented as protein expression relative to actin (C). Results are mean ± S.D. of three different experiments. a, p < 0.001 versus control; b, p < 0.001 versus LPS; c, p < 0.001 versus (LPS + RNS60). Cells preincubated with LY294002 or AktI for 30 min were treated with RNS60 (10% v/v) under serum-free conditions. Rel., relative. After 1 h of treatment, the level of IκBα was monitored by Western blot (D) and real time PCR (E). Results are mean ± S.D. of three different experiments. a, p < 0.001 versus control; b, p < 0.001 versus RNS60. F, cells were co-transfected with 0.25 μg of PBIIX-Luc and 12.5 ng of pRL-TK. Twenty four hours after transfection, cells were incubated with LY294002 or AktI for 30 min followed by treatment with RNS60 (10% v/v) under serum-free conditions. After 2 h of treatment, cells were stimulated with LPS for 4 h followed by assay of firefly and Renilla luciferase activities. Results are mean ± S.D. of three different experiments. a, p < 0.001 versus control; b, p < 0.01 versus LPS; c, p < 0.01 versus (LPS + RNS60).
FIGURE 9.
FIGURE 9.
Expression of Δp85α (a dominant-negative mutant of p85α) and p110* (a catalytically active mutant of p110α/β) modulates the expression of IκBα. Mouse BV-2 microglial cells were transfected with 0.25 μg of either Δp85α or an empty vector. Twenty four hours after transfection, cells were incubated with RNS60 for 2 h followed by monitoring the expression of IκBα by Western blot (A) and real time PCR (B). Rel., relative. Cells were transfected with different amounts of p110*, p110-kd (a kinase-dead mutant) or an empty vector. Twenty four hours after transfection, cells were incubated in serum-free media for 2 h followed by monitoring the expression of IκBα by Western blot (C) and real time PCR (D). Results represent mean ± S.D. of three separate experiments. a, p < 0.001 versus empty vector; b, p < 0.001 versus empty vector-RNS60.
FIGURE 10.
FIGURE 10.
RNS60 induces the activation of CREB in mouse microglial cells via PI 3-kinase-Akt pathway. A, BV-2 microglial cells were stimulated with RNS60 and NS for different time periods followed by monitoring the levels of phospho-CREB and total CREB by Western blot. B, bands were scanned and results presented as phospho-CREB/total CREB. Results are mean ± S.D. of three different experiments. a, p < 0.001 versus control. C, cells were stimulated with RNS60 for different time periods followed by monitoring the DNA binding activity of CREB by EMSA. D, cells plated in 12-well plates were co-transfected with 0.25 μg of pCRE-Luc (an CREB-dependent reporter construct) and 12.5 ng of pRL-TK. Twenty four hours after transfection, cells received different concentrations of RNS60 and NS. After 2 h of incubation, firefly and Renilla luciferase activities were obtained by analyzing the total cell extract. a, p < 0.001 versus control. Rel., relative. E, cells preincubated with LY294002 (LY) (10 μm) or AktI (10 μm) for 30 min were treated with RNS60 (10% v/v) under serum-free conditions. After 30 min of treatment, the levels of phospho-CREB and total CREB were monitored by Western blot. F, effect of LY294002 and AktI was tested on the transcriptional activity of CREB using pCRE-Luc as described above. Results are mean ± S.D. of three different experiments. a, p < 0.001 versus control; b, p < 0.001 versus RNS60.
FIGURE 11.
FIGURE 11.
RNS60 up-regulates the expression of IκBα in mouse microglial cells via CREB. A, BV-2 microglial cells plated in 12-well plates were transfected with 0.25 μg of either CREB siRNA or control (Cont) siRNA, and after 24 h of transfection, the level of CREB protein was monitored by Western blot. Actin was run as a control. Bands were scanned, and results are presented as protein expression relative to actin (B). Rel., relative. Results are mean ± S.D. of three different experiments. a, p < 0.001 versus control siRNA. Cells were transfected with 0.25 μg of either CREB siRNA or control siRNA, and after 24 h of transfection, cells were treated with different concentrations of RNS60. After 1 h of treatment, the expression of IκBα was monitored by real time PCR (C) and Western blot (D). Bands were scanned, and results are presented as protein expression relative to actin (E). Results represent mean ± S.D. of three separate experiments. a, p < 0.001 versus no RNS60-control siRNA; b, p < 0.001 versus RNS60–30-min control siRNA; c, p < 0.001 versus RNS60–60-min control siRNA.

Similar articles

Cited by

References

    1. Giovannini M. G., Scali C., Prosperi C., Bellucci A., Vannucchi M. G., Rosi S., Pepeu G., Casamenti F. (2002) β-Amyloid-induced inflammation and cholinergic hypofunction in the rat brain in vivo. Involvement of the p38MAPK pathway. Neurobiol. Dis. 11, 257–274 - PubMed
    1. Dauer W., Przedborski S. (2003) Parkinson disease. Mechanisms and models. Neuron 39, 889–909 - PubMed
    1. Gao H. M., Liu B., Zhang W., Hong J. S. (2003) Novel anti-inflammatory therapy for Parkinson disease. Trends Pharmacol. Sci. 24, 395–401 - PubMed
    1. Barnum C. J., Tansey M. G. (2010) Modeling neuroinflammatory pathogenesis of Parkinson disease. Prog. Brain Res. 184, 113–132 - PubMed
    1. Jantaratnotai N., Ryu J. K., Kim S. U., McLarnon J. G. (2003) Amyloid β peptide-induced corpus callosum damage and glial activation in vivo. Neuroreport 14, 1429–1433 - PubMed

Publication types

MeSH terms