. 2012 Jul 17;109(29):11854-9.
doi: 10.1073/pnas.1205381109. Epub 2012 Jul 2.

Emergence of neural encoding of auditory objects while listening to competing speakers

Affiliations

Emergence of neural encoding of auditory objects while listening to competing speakers

Nai Ding et al. Proc Natl Acad Sci U S A. .

Abstract

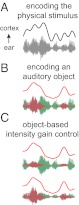
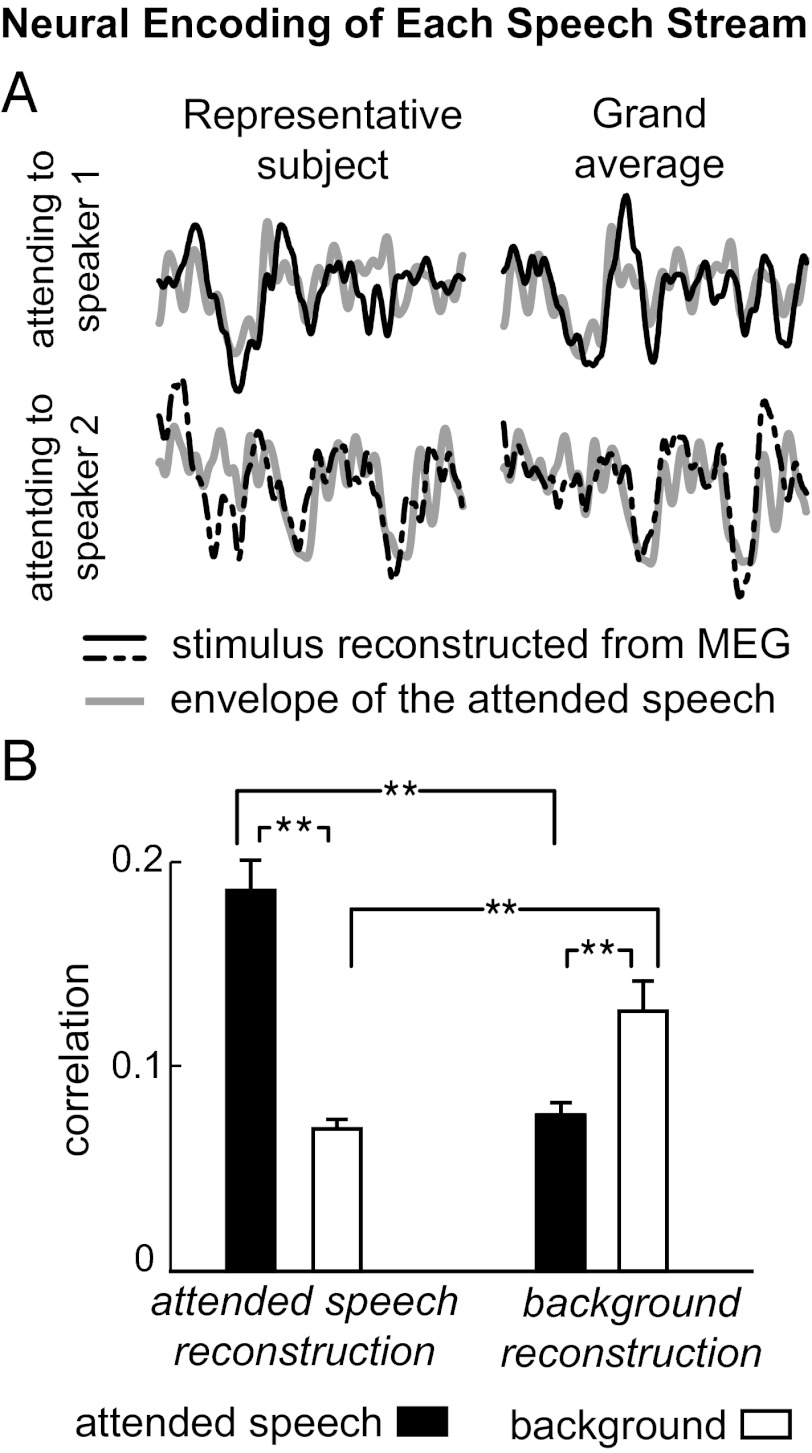
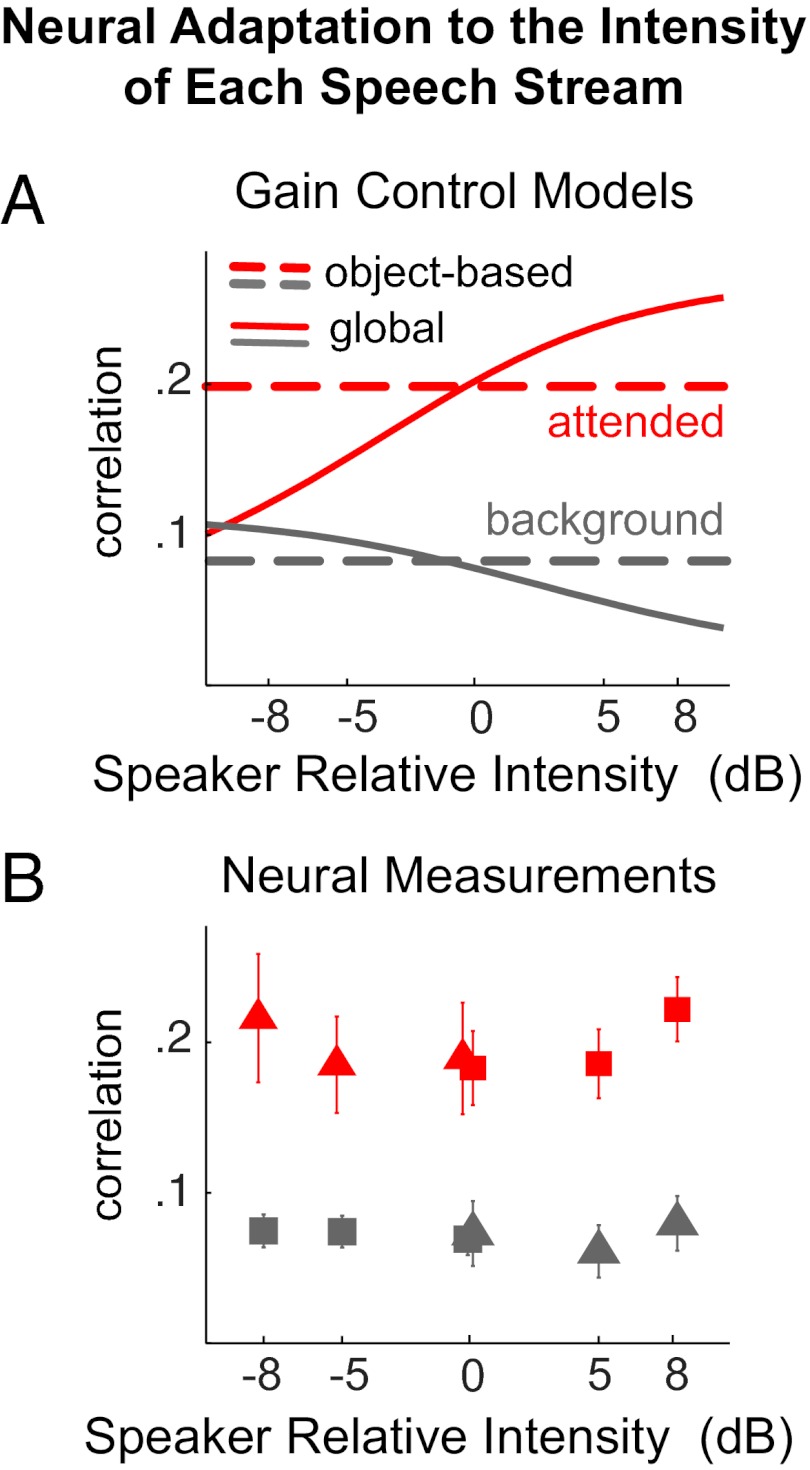
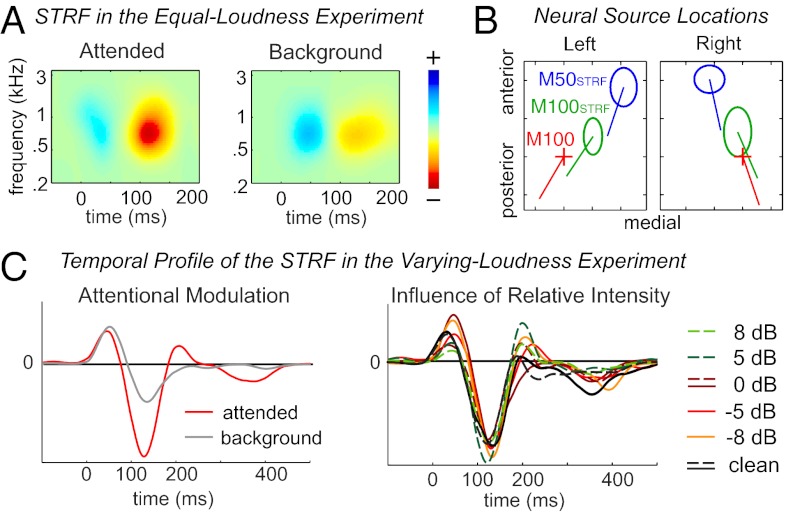
A visual scene is perceived in terms of visual objects. Similar ideas have been proposed for the analogous case of auditory scene analysis, although their hypothesized neural underpinnings have not yet been established. Here, we address this question by recording from subjects selectively listening to one of two competing speakers, either of different or the same sex, using magnetoencephalography. Individual neural representations are seen for the speech of the two speakers, with each being selectively phase locked to the rhythm of the corresponding speech stream and from which can be exclusively reconstructed the temporal envelope of that speech stream. The neural representation of the attended speech dominates responses (with latency near 100 ms) in posterior auditory cortex. Furthermore, when the intensity of the attended and background speakers is separately varied over an 8-dB range, the neural representation of the attended speech adapts only to the intensity of that speaker but not to the intensity of the background speaker, suggesting an object-level intensity gain control. In summary, these results indicate that concurrent auditory objects, even if spectrotemporally overlapping and not resolvable at the auditory periphery, are neurally encoded individually in auditory cortex and emerge as fundamental representational units for top-down attentional modulation and bottom-up neural adaptation.


Conflict of interest statement

The authors declare no conflict of interest.

Figures

Fig. 1.
Fig. 1.
Illustration of object-based neural representations. Here, the auditory scene is illustrated using a mixture of two concurrent speech streams. (A) If a complex auditory scene is not neurally parsed into separate auditory objects, cortical activity (Upper, curve) phase locks to the temporal envelope of the physical stimulus [i.e., the acoustic mixture (Lower, waveform)]. (B) In contrast, using the identical stimulus (but illustrated here with the unmixed instances of speech in different colors), for a hypothetical neural representation of an individual auditory object, neural activity would instead selectively phase lock to the temporal envelope only of that auditory object. (C) Neural representation of an auditory object should, furthermore, neurally adapt to an intensity change of its own object (Upper) but should remain insensitive to intensity changes in another auditory object (Lower). Neither of these modifications to the acoustic stimulus therefore significantly changes the neural representation (comparing A and C).
Fig. 2.
Fig. 2.
Decoding the cortical representation specific to each speech stream. (A) Examples of the envelope reconstructed from neural activity (black), superimposed on the actual envelope of the attended speech when presented in isolation (gray). (Upper and Lower) Different envelopes are decoded from neural responses to identical stimuli, depending on whether the listener attends to one or the other speaker in the speech mixture, with each resembling the envelope of the attended speech. Here, the signals, 5 s in duration, are averaged over three trials for illustrative purposes, but all results in the study are based on single-trial analysis. (B) Two separate decoders reconstruct the envelope of the attended and background speech, respectively, from their separate spatial-temporal neural responses to the speech mixture. The correlation between the decoded envelope and the actual envelope of each speech stream is shown in the bar graph (averaged over trials and speakers), with each error bar denoting 1 SEM across subjects (**P < 0.005, paired permutation test). The separate envelopes reconstructed by the two decoders selectively resemble that of attended and background speech, demonstrating a separate neural code for each speech stream.
Fig. 3.
Fig. 3.
Decoding the attended speech over a wide range of relative intensity between speakers. (A) Decoding results simulated using different gain control models. The x axis shows the intensity of the attended speaker relative to the intensity of the background speaker. The red and gray curves show the simulated decoding results for the attended and background speakers, respectively. Object-based intensity gain control predicts a speaker intensity invariant neural representation, whereas the global gain control mechanism does not. (B) Neural decoding results in the Varying-Loudness experiment. The cortical representation of the target speaker (red symbols) is insensitive to the relative intensity of the target speaker. The acoustic envelope reconstructed from cortical activity is much more correlated with the attended speech (red symbols) than the background speech (gray symbols). Triangles and squares are results from the two speakers, respectively.
Fig. 4.
Fig. 4.
Cortical encoding of the spectral-temporal features of different speech streams. (A) STRFs for the attended and background speech, at the neural source location of the M100STRF. Attention strongly enhances the response with latency near 100 ms. (B) Neural source locations for the M50STRF and M100STRF in each hemisphere, as estimated by dipole fitting. The location of the neural source of the M50STRF is anterior and medial to that of the M100STRF and M100. The source location for each subject is aligned based on the source of the M100 response to tone pips, shown by the cross. The span of each ellipse is 2 SEM across subjects. The line from each dipole location illustrates the grand averaged orientation of each dipole. Each tick represents 5 mm. (C) Temporal profile of the STRF in the Varying-Loudness experiment for the attended speech. The M100STRF (averaged over TMR) is strongly modulated by attention, whereas the M50STRF is not (Left). Neither response peak is affected by the intensity change of the two speakers (Right).

References

    1. Bregman AS. Auditory Scene Analysis: The Perceptual Organization of Sound. Cambridge, MA: MIT Press; 1990.
    1. Shinn-Cunningham BG. Object-based auditory and visual attention. Trends Cogn Sci. 2008;12(5):182–186. - PMC - PubMed
    1. Shamma SA, Elhilali M, Micheyl C. Temporal coherence and attention in auditory scene analysis. Trends Neurosci. 2011;34(3):114–123. - PMC - PubMed
    1. Griffiths TD, Warren JD. What is an auditory object? Nat Rev Neurosci. 2004;5:887–892. - PubMed
    1. Fishman YI, Steinschneider M. Formation of auditory streams. In: Rees A, Palmer A, editors. The Oxford Handbook of Auditory Science: The Auditory Brain. Vol 2. New York: Oxford Univ Press; 2010. pp. 215–245.

Publication types