. 2012 Jul 17;109(29):11630-5.
doi: 10.1073/pnas.1204718109. Epub 2012 Jul 2.

High-throughput single-microparticle imaging flow analyzer

Affiliations

High-throughput single-microparticle imaging flow analyzer

Keisuke Goda et al. Proc Natl Acad Sci U S A. .

Abstract

Optical microscopy is one of the most widely used diagnostic methods in scientific, industrial, and biomedical applications. However, while useful for detailed examination of a small number (< 10,000) of microscopic entities, conventional optical microscopy is incapable of statistically relevant screening of large populations (> 100,000,000) with high precision due to its low throughput and limited digital memory size. We present an automated flow-through single-particle optical microscope that overcomes this limitation by performing sensitive blur-free image acquisition and nonstop real-time image-recording and classification of microparticles during high-speed flow. This is made possible by integrating ultrafast optical imaging technology, self-focusing microfluidic technology, optoelectronic communication technology, and information technology. To show the system's utility, we demonstrate high-throughput image-based screening of budding yeast and rare breast cancer cells in blood with an unprecedented throughput of 100,000 particles/s and a record false positive rate of one in a million.


Conflict of interest statement

The authors declare no conflict of interest.

Figures

Fig. 1.
Fig. 1.
STEAM flow analyzer. An animated video that shows the integrated functionality of the system is available (Movie S1). (A) Schematic of the STEAM flow analyzer that highlights the optical layout of the STEAM camera and real-time optoelectronic time-stretch image processor. The STEAM camera takes blur-free images of fast-flowing particles in the microfluidic device. The acquired images are optoelectronically processed and screened in the real-time optoelectronic time-stretch image processor. (B) Microfluidic device in which particles are controlled to flow at a uniform velocity and focused and ordered by inertial lift forces in the microfluidic channel. (C) Field-programmable digital image processor that captures particles and performs fully automated particle classification in real time. It consists of (i) a high-speed analog-to-digital converter (ADC); (ii) a field-programmable gate array (FPGA) for particle capture, E-slide generation, and coarse particle classification; (iii) an on-board memory circuit for storing selected E-slides; and (iv) a central processing unit (CPU) for fine particle classification.
Fig. 2.
Fig. 2.
Performance of the STEAM camera and comparison with a conventional CCD camera and a state-of-the-art CMOS camera. E-slides of flowing particles of various species in the microfluidic device were generated by the STEAM flow analyzer with the built-in STEAM camera (27 ps shutter speed, 128 × 512 pixels, 25 dB optical image gain). The E-slides are compared with images of the same particles captured by a state-of-the-art CMOS camera (1 μs shutter speed, 32 × 32 pixels, no optical image gain) under the same flow. To operate at these high speeds, the CMOS camera used partial readout, limiting the number of pixels to 32 × 32. Here the particles were controlled to flow at a uniform speed of 4 m/s, which corresponds to a throughput of 100,000 particles/s based on the volumetric flow rate. The high-speed motion of the particles was frozen by the ultrafast shutter speed (ultrashort exposure time) of the STEAM camera (27 ps) yet without sacrificing sensitivity due to the optical image amplification whereas the reduced sensitivity and motion blurs caused by the CMOS camera’s much lower shutter speed and lack of optical image amplification are evident. For further comparison, stationary particles of the same types on a glass slide were obtained under a conventional microscope with a CCD camera with a much longer exposure time (17 ms shutter speed, 1,280 × 1,024 pixels, no optical image gain). Despite the fact that the STEAM camera is many orders of magnitude faster than the CCD camera, the two cameras share similar image quality (i.e., sensitivity and resolution).
Fig. 3.
Fig. 3.
High-throughput screening of budding yeast with the STEAM flow analyzer. (A) Screening process of the field-programmable digital image processor. The FPGA performs cell capture while ignoring the blank images between cells and stores the corresponding E-slides into the on-board memory. The CPU then distinguishes between budding and unbudded cells, classifies the budding cells by daughter-to-mother ratio in size, and finally generates a histogram for the subpopulations. (B) Subpopulation analysis of yeast at different stages of budding. The total number of captured yeast cells is 75,509, about 34% of which constitutes budding cells. Here the entire procedure that consists of the measurement, image analysis, and histogram generation takes less than a few minutes. Because the STEAM flow analyzer operates in real time, time-resolved statistical analysis of the subpopulations can also be performed to control and optimize the budding process. Furthermore, similar capture and subpopulation analysis can also be applied to emulsions for applications in cosmetics and pharmaceutics.
Fig. 4.
Fig. 4.
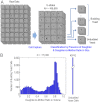
Rare cell detection with the STEAM flow analyzer. (A) Scatter plots of white blood cells and MCF7 cells based on the cell size (i.e., area) and the presence of the surface antigens (i.e., metal beads). The total number of events is approximately 10,000 for both cell types. This statistical analysis is used to build a model and train the supervised learning method and hence the algorithms to run the field-programmable digital image processor. The threshold for the size-based selection performed on the FPGA is set such that smaller MCF7 cells are also selected at the expense of detecting larger white blood cells. The rare white blood cell events that overlap with the distribution of MCF7 cells are doublets or clusters and can hence be rejected by imaging (which is not possible with single-point detection methods). (B) Selection process of the field-programmable digital image processor. The FPGA performs cell capture, coarse size-based classification, and filters out more than 99.9995% of white blood cells while leaving only false positive events of the order of 100 per mL of lysed blood along with true positive events. The CPU then performs fine classification by circularity and presence of metal beads and further down-selects cells by an order of magnitude, leaving true positive events and false positive events of the order of 10 per mL of lysed blood, which arise due to image processing artifacts which can further be rejected by human visual inspection. (C) Statistical analysis of the system’s capture efficiency for various concentrations. The results indicate that the field-programmable digital image processor can identify extremely rare cell with a high efficiency of 75% (limited by the imperfect coating efficiency and missing smaller MCF7 cells in the FPGA selection process). Here all the measurements were performed with bead-coated MCF7 cells spiked in buffer containing white blood cells from 3 mL of lysed blood (approximately 80 million white blood cells) at a throughput of 100,000 cells/s. Individual samples were measured four times, establishing that the classification is highly repeatable (indicated by the vertical error bars). Moreover, the correlation of detected MCF7 cells with spiked MCF7 cells is good (r2 = 0.94). The horizontal deviations can be attributed to several known sources of error in the spiking method including the initial hemacytometer count (see Materials and Methods). (D) ROC curve analysis of the STEAM flow analyzer in comparison with the conventional flow cytometer. Our method is sufficiently sensitive for detection of approximately one MCF7 cell in a million white blood cells (i.e., a false positive rate of approximately 10-6) and is two orders of magnitude better in terms of false positive rate than the conventional scattering- and fluorescence-based flow cytometer yet without sacrificing throughput.

References

    1. Mertz JC. Introduction to Optical Microscopy. Greenwood Village, CO: Roberts and Company Publishers; 2009.
    1. Pawley J. Handbook of Biological Confocal Microscopy. New York: Springer; 2006.
    1. Drapcho C, Nghiem J, Walker T. Biofuels Engineering Process Technology. New York: McGraw-Hill Professional; 2008.
    1. Wollman R, Stuurman N. High throughput microscopy: From raw images to discoveries. J Cell Sci. 2007;120:3715–3722. - PubMed
    1. Tse HTK, Meng P, Gossett DR, Irturk A, Kastner R, Di Carlo D. Strategies for implementing hardware-assisted high-throughput cellular image analysis. J Lab Autom. 2011;16:422–430. - PubMed

Publication types