. 2012 Jul 17;109(29):11570-5.
doi: 10.1073/pnas.1204514109. Epub 2012 Jul 2.

Functional single-cell hybridoma screening using droplet-based microfluidics

Affiliations

Functional single-cell hybridoma screening using droplet-based microfluidics

Bachir El Debs et al. Proc Natl Acad Sci U S A. .

Abstract

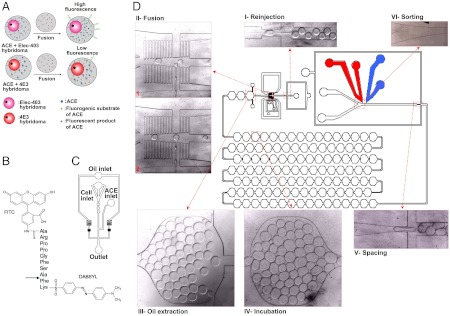
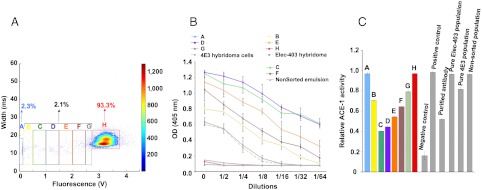
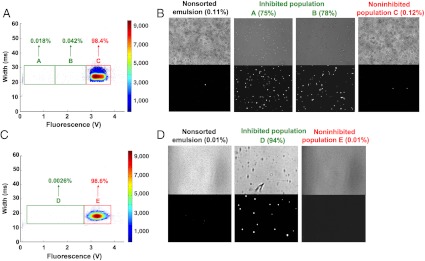
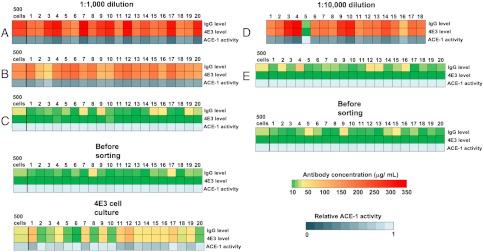
Monoclonal antibodies can specifically bind or even inhibit drug targets and have hence become the fastest growing class of human therapeutics. Although they can be screened for binding affinities at very high throughput using systems such as phage display, screening for functional properties (e.g., the inhibition of a drug target) is much more challenging. Typically these screens require the generation of immortalized hybridoma cells, as well as clonal expansion in microtiter plates over several weeks, and the number of clones that can be assayed is typically no more than a few thousand. We present here a microfluidic platform allowing the functional screening of up to 300,000 individual hybridoma cell clones within less than a day. This approach should also be applicable to nonimmortalized primary B-cells, as no cell proliferation is required: Individual cells are encapsulated into aqueous microdroplets and assayed directly for the release of antibodies inhibiting a drug target based on fluorescence. We used this system to perform a model screen for antibodies that inhibit angiotensin converting enzyme 1, a target for hypertension and congestive heart failure drugs. When cells expressing these antibodies were spiked into an unrelated hybridoma cell population in a ratio of 1:10,000 we observed a 9,400-fold enrichment after fluorescence activated droplet sorting. A wide variance in antibody expression levels at the single-cell level within a single hybridoma line was observed and high expressors could be successfully sorted and recultivated.


Conflict of interest statement

Conflict of interest statement: C.A.M and A.D.G are inventors on patent applications including some of the ideas described in this manuscript.

Figures

Fig. 1.
Fig. 1.
Microfluidic setup. (A) A mixed population of hybridoma cells either expressing the ACE-1 inhibitory antibody 4E3 or the noninhibitory antibody Elec-403 is encapsulated into droplets together with recombinant ACE-1. (B) Fluorogenic ACE-1 substrate. The ACE-1 cleavage site is indicated by an arrow. (C) Microfluidic chip for cell encapsulation. (D) Integrated microfluidic chip for the reinjection of droplets after a 6 h off-chip incubation period. Droplets hosting cells are fused with droplets containing the fluorogenic ACE-1 substrate and subsequently incubated for 30 min in a delay line. The final sorting module allows specific collection of droplets with low fluorescence intensity (indicating inhibition of ACE-1).
Fig. 2.
Fig. 2.
Sorting of 4E3 hybridoma cells mixed with a 75-fold excess of unrelated control cells. A population of calcein-red/orange-stained hybridoma cells expressing 4E3 antibody and nonstained hybridoma cells expressing Elec-403 antibody was mixed in a 1∶75 ratio and sorted. The fluorescence signals (green channel corresponding to ACE-1 activity; x axis) of the drops at the sorting junction were plotted against the droplet width (y axis) and gates for the collection of droplets with specific fluorescence intensity were set (green and red rectangles). The relative frequency of all events is color coded as indicated on the right. Bright field (Top) and red/orange fluorescence (Bottom) images shows the nonsorted cell population as well as cells recovered from droplets within the specific gates. The percentage of calcein-red/orange-stained hybridoma cells is indicated.
Fig. 3.
Fig. 3.
Biochemical characterization of supernatants from recovered cells after sorting a 1∶75 mixture of 4E3 and Elec-403 hybridoma cells. (A) The fluorescence signals (green channel corresponding to ACE-1 activity; x axis) of the drops at the sorting junction were plotted against the droplet width (y axis). The relative frequency of all events is color coded as indicated on the right. Cells were recovered from droplets within gates for specific fluorescence intensities (colored rectangles labeled with capital letters), expanded and characterized biochemically (B and C). The percentage of total droplets in each gate is indicated. (B) Concentration of 4E3 antibody in the supernatant of the recovered, expanded, cells determined by ELISA. Error bars correspond to ± 1 standard deviation. (C) Activity of recombinant ACE-1 in the presence of the corresponding cell culture supernatants. Control samples refer to samples without ACE-1 (negative) or without antibodies (positive).
Fig. 4.
Fig. 4.
Selection of individual hybridoma cell clones from large heterogeneous populations. Mixed populations of calcein-red/orange-stained hybridoma cells expressing 4E3 antibody and nonstained hybridoma cells expressing Elec-403 antibody in ratios of 1∶1,000 (A) and 1∶10,000 (C) were sorted. The fluorescence signals (green channel corresponding to ACE-1 activity; x axis) of the drops at the sorting junction were plotted against the droplet width (y axis) and gates for the collection of droplets with specific fluorescence intensity were set (green and red rectangles). The percentage of total droplets in each gate is indicated. The relative frequency of all events is color coded as indicated on the right. (B and D) Bright field (Top) and red/orange fluorescence (Bottom) images of the 1∶1,000 and 1∶10,000 cell dilutions before the sort and after recovery from droplets within the specific gates. The percentage of calcein-red/orange-stained hybridoma cells is indicated.
Fig. 5.
Fig. 5.
Biochemical characterization of supernatants from individually expanded hybridoma cell clones before sorting and after recovery from droplets within the specific gates. After clonal expansion of single hybridoma cells isolated from droplets within the specific gates, 500 cells of each clone were seeded in 200 μL of fresh media and the supernatants were analyzed after five days of incubation. In parallel 500 cells from each gate were pooled and characterized the same way (except for the 1∶10,000 sorting where the total number of cells isolated from the inhibited population was 18). The heat maps show the total concentration of antibodies and the concentration of 4E3 antibodies (color coded from green to red), as well as the relative ACE-1 activity of the same supernatants (color coded from dark blue to light blue). The dilution refers to the ratio of 4E3 cells to Elec-403 cells before the sort. Capital letters (A–E) correspond to the gates used during droplet sorting as specified in Fig. 4.

References

    1. Nelson AL, Dhimolea E, Reichert JM. Development trends for human monoclonal antibody therapeutics. Nat Rev Drug Discov. 2010;9:767–774. - PubMed
    1. Walsh G. Biopharmaceutical benchmarks 2010. Nat Biotechnol. 2010;28:917–924. - PubMed
    1. Hoogenboom HR. Selecting and screening recombinant antibody libraries. Nat Biotechnol. 2005;23:1105–1116. - PubMed
    1. Karsunke XY, et al. Screening and characterization of new monoclonal anti-benzo[a]pyrene antibodies using automated flow-through microarray technology. J Immunol Methods. 2011;371:81–90. - PubMed
    1. Sawyer A, et al. High throughput production of mouse monoclonal antibodies using antigen microarrays. Proteomics. 2005;5:4070–4081. - PubMed

MeSH terms

Substances