. 2012 Sep 6;120(10):2076-86.
doi: 10.1182/blood-2011-12-399683. Epub 2012 Jul 2.

Stem and progenitor cells in myelodysplastic syndromes show aberrant stage-specific expansion and harbor genetic and epigenetic alterations

Affiliations

Stem and progenitor cells in myelodysplastic syndromes show aberrant stage-specific expansion and harbor genetic and epigenetic alterations

Britta Will et al. Blood. .

Abstract

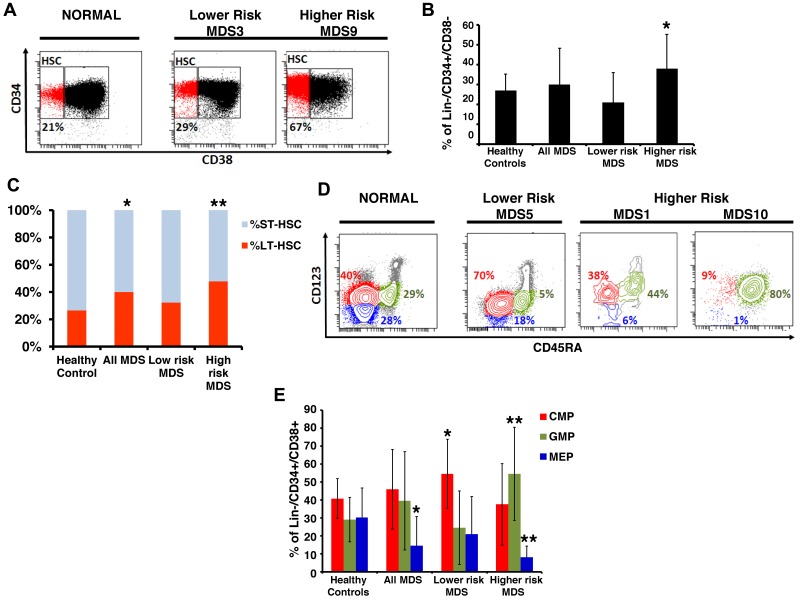
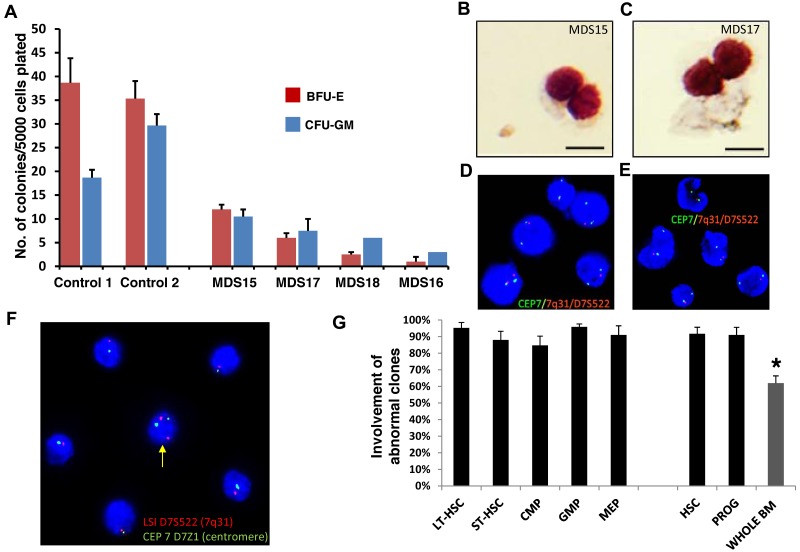
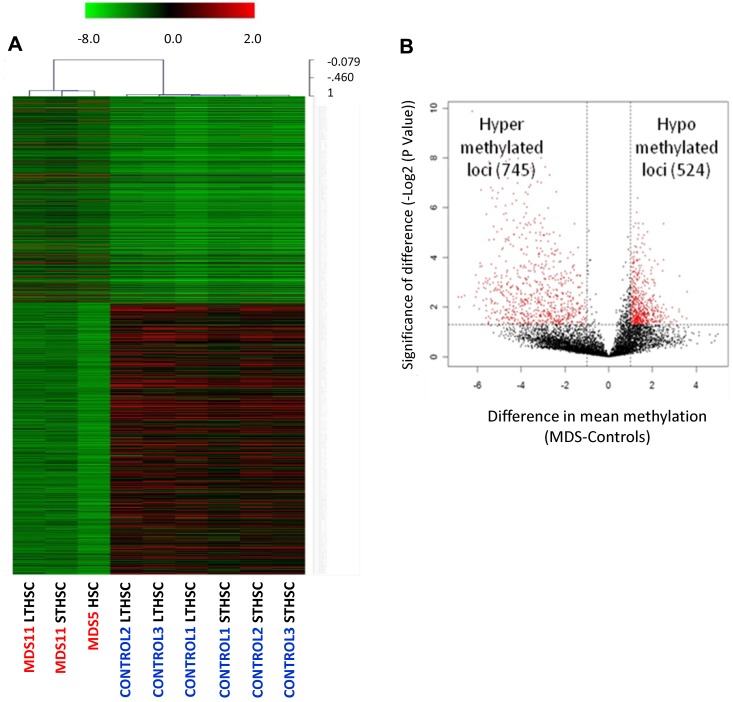
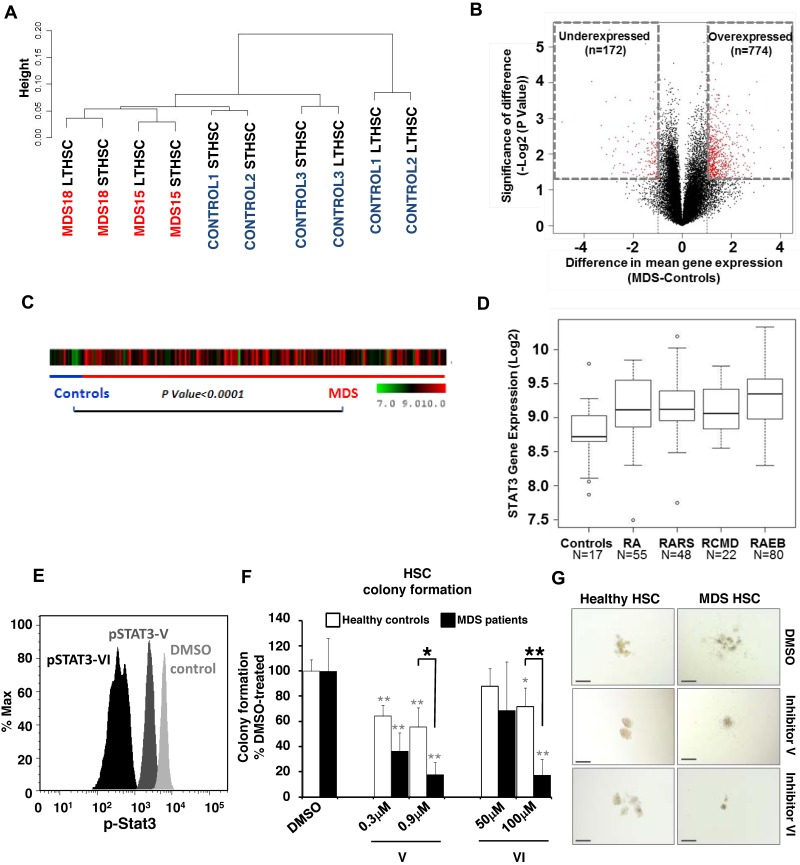
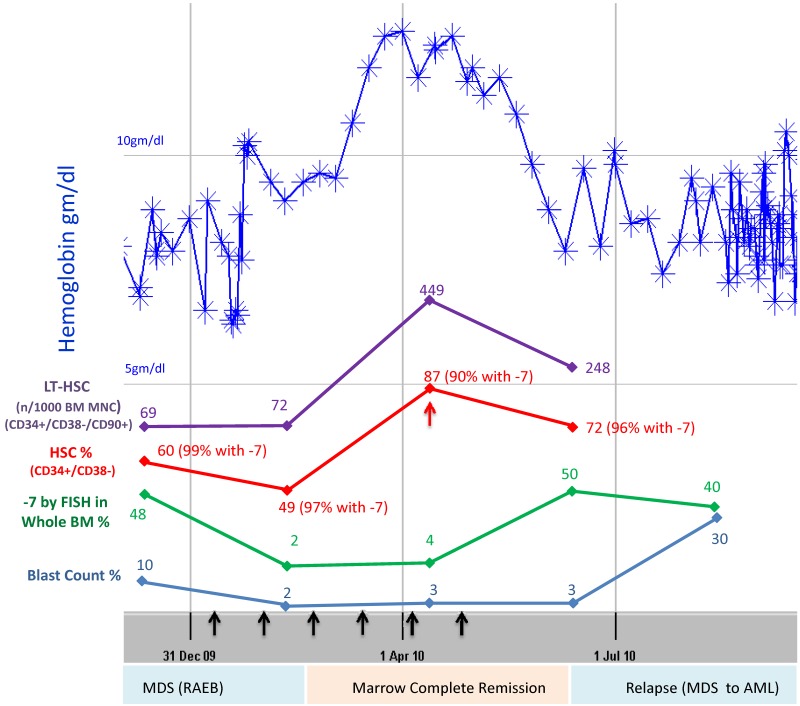
Even though hematopoietic stem cell (HSC) dysfunction is presumed in myelodysplastic syndrome (MDS), the exact nature of quantitative and qualitative alterations is unknown. We conducted a study of phenotypic and molecular alterations in highly fractionated stem and progenitor populations in a variety of MDS subtypes. We observed an expansion of the phenotypically primitive long-term HSCs (lineage(-)/CD34(+)/CD38(-)/CD90(+)) in MDS, which was most pronounced in higher-risk cases. These MDS HSCs demonstrated dysplastic clonogenic activity. Examination of progenitors revealed that lower-risk MDS is characterized by expansion of phenotypic common myeloid progenitors, whereas higher-risk cases revealed expansion of granulocyte-monocyte progenitors. Genome-wide analysis of sorted MDS HSCs revealed widespread methylomic and transcriptomic alterations. STAT3 was an aberrantly hypomethylated and overexpressed target that was validated in an independent cohort and found to be functionally relevant in MDS HSCs. FISH analysis demonstrated that a very high percentage of MDS HSC (92% ± 4%) carry cytogenetic abnormalities. Longitudinal analysis in a patient treated with 5-azacytidine revealed that karyotypically abnormal HSCs persist even during complete morphologic remission and that expansion of clonotypic HSCs precedes clinical relapse. This study demonstrates that stem and progenitor cells in MDS are characterized by stage-specific expansions and contain epigenetic and genetic alterations.


Figures

Figure 1
Figure 1
MDS BM shows expanded stem and progenitor populations. (A) Representative samples of lower- and higher-risk MDS and a healthy control. Shown are FACS analyses of anti-CD34/CD38 costainings within CD34-enriched, viable, lineage marker-negative BM mononuclear cells. (B) Quantification of phenotypic HSCs in healthy control patients (N = 16), lower-risk (n = 8), and higher-risk (n = 9) MDS patients showing a significant expansion of the HSC compartment in patients with higher-risk MDS compared with controls (P < .05, t test). (C) Quantification of phenotypic LT-HSCs and ST-HSCs in healthy control patients (N = 16), lower-risk (n = 8), and higher-risk (n = 9) MDS patients. *P < .05 (t test). **P < .005 (t test). (D) Representative samples of 1 lower-risk and 2 higher-risk MDS patients and a healthy control patient. Shown are FACS analyses of CD123 and CD45RA expression on viable, lineage marker-negative CD34+CD38+ BM mononuclear cells defining myeloid populations: red represents CMP; blue, MEP; and green, GMP. (E) Quantification of phenotypic myeloid progenitors in healthy control patients (N = 16), lower-risk (n = 8), and higher-risk (n = 9) MDS patients showing a significant expansion of the CMP compartment in patients with lower-risk MDS, and significant expansion of the GMP compartment, and significant reduction of the MEP compartment in higher-risk MDS. *P < .05 (t test). **P < .005 (t test).
Figure 2
Figure 2
Cytogenetic alterations are seen in MDS HSCs. (A) Colony formation assay using sorted LinCD34+CD38 cells from 4 MDS patients and 2 healthy controls. Data are mean ± SD for colonies arising from BFU-E and CFU-GM per 5000 plated cells. (B-C) Microscopic image of MDS patient-derived, sorted LinCD34+CD38 cells grown in the semisolid culture for 12 days. DiffQuick staining of cytospun cells. Scale bar represents 50 μm. (D-E) FISH analysis of day 12 colonies from 2 patients with MDS. (F) Sorted HSCs from 1 patient with MDS showing monosomy of chromosome 7 in the majority of cells and 1 cell (yellow arrow) with both copies of chromosome 7 (red probe for 7q31 and centromeric green probe). (G) Mean percentages and SEM of abnormal karyotypic clones in lower-risk MDS HSC and progenitor compartments. Gray bar represents the results obtained from whole BM from the clinical diagnostic laboratory. *P < .05 (2-tailed t test).
Figure 3
Figure 3
Genome-wide DNA methylation analysis of sorted cells reveals widespread changes in MDS HSCs. (A) Hierarchal clustering and heatmap based on methylation profiling reveals differences between MDS HSCs and control HSCs. (B) Volcano plot based on difference of mean methylation and significance of the difference shows both aberrant hypermethylated and hypomethylated loci in MDS HSCs (LinCD34+CD38). Red dots indicate P < .05 and fold change > 1 log2.
Figure 4
Figure 4
Gene expression analysis of sorted cells reveals differences between MDS and control HSCs. (A) Unsupervised hierarchal clustering based on gene expression reveals differences between MDS and control HSCs. (B) Volcano plot comparing the difference of mean expression (x-axis) and significance of the difference (y-axis), showing mainly overexpressed genes in MDS HSCs. Red dots indicate P < .05 and fold change > 1 log2. (C) STAT3 gene expression in 183 samples of MDS CD34+ cells and 17 healthy controls is shown as a heatmap. (D) Expression is higher in MDS compared with controls (t test with Benjamin-Hochberg correction). Boxplots show the expression of STAT3 in various FAB subtypes of MDS (RCMD is a subset of the FAB RA category). (E) Phosphoflow analysis showing a reduction of pSTAT3 in CD34+ BM-derived cells 36 hours after treatment with 0.9μM STAT3 inhibitor V and 100μM STAT3 inhibitor VI. (F) Colony formation of LinCD34+CD38 HSCs derived from patients with MDS (solid bars) and healthy controls (open bars) treated with 0.3 or 0.9μM inhibitor V, 50 or 100μM inhibitor VI, or DMSO showing a significant reduction of MDS colonies when treated with either inhibitor. Shown are averages of colony numbers expressed as percentage of DMSO-treated colony formation (NMDS = 3; and NHealthy = 2). Black asterisks represent P values from t tests comparing inhibition of colony formation of MDS with healthy control-derived cells; and gray asterisks, P values from t tests comparing inhibition of colony formation of STAT3 inhibitor-treated versus DMSO-treated cells. *P < .05. **P < .01. (G) Representative pictures of HSC-derived colonies in the presence of STAT3 inhibitor V, VI, or DMSO control. Bars represent 200 μm.
Figure 5
Figure 5
Abnormal HSCs persist during remission, and their expansion occurs before clinical relapse. MDS9 patient has refractory anemia with excess blasts and attained remission with 5-azacytidine + vorinostat treatment (black arrows) with improvement of anemia (top blue line). Even when the patient was in remission, the HSC compartment was expanded (red line) and harbored cells with monosomy 7 (49% HSCs; FISH showed 97% of these had monosomy 7). Further expansion of HSCs (red arrow) occurred 2 months before relapse with increasing blasts and progressive anemia.

Comment in

References

    1. Jordan CT, Guzman ML, Noble M. Cancer stem cells. N Engl J Med. 2006;355(12):1253–1261. - PubMed
    1. Jamieson CH, Ailles LE, Dylla SJ, et al. Granulocyte-macrophage progenitors as candidate leukemic stem cells in blast-crisis CML. N Engl J Med. 2004;351(7):657–667. - PubMed
    1. Tehranchi R, Woll PS, Anderson K, et al. Persistent malignant stem cells in del(5q) myelodysplasia in remission. N Engl J Med. 2010;363(11):1025–1037. - PubMed
    1. Nilsson L, Eden P, Olsson E, et al. The molecular signature of MDS stem cells supports a stem-cell origin of 5q myelodysplastic syndromes. Blood. 2007;110(8):3005–3014. - PubMed
    1. Nilsson L, Astrand-Grundstrom I, Arvidsson I, et al. Isolation and characterization of hematopoietic progenitor/stem cells in 5q−deleted myelodysplastic syndromes: evidence for involvement at the hematopoietic stem cell level. Blood. 2000;96(6):2012–2021. - PubMed

Publication types

MeSH terms