. 2012 Jul 9;198(1):103-14.
doi: 10.1083/jcb.201111063. Epub 2012 Jul 2.

Bnip3 and AIF cooperate to induce apoptosis and cavitation during epithelial morphogenesis

Affiliations

Bnip3 and AIF cooperate to induce apoptosis and cavitation during epithelial morphogenesis

Yanmei Qi et al. J Cell Biol. .

Erratum in

  • J Cell Biol. 2013 Apr 1;201(1):165

Abstract

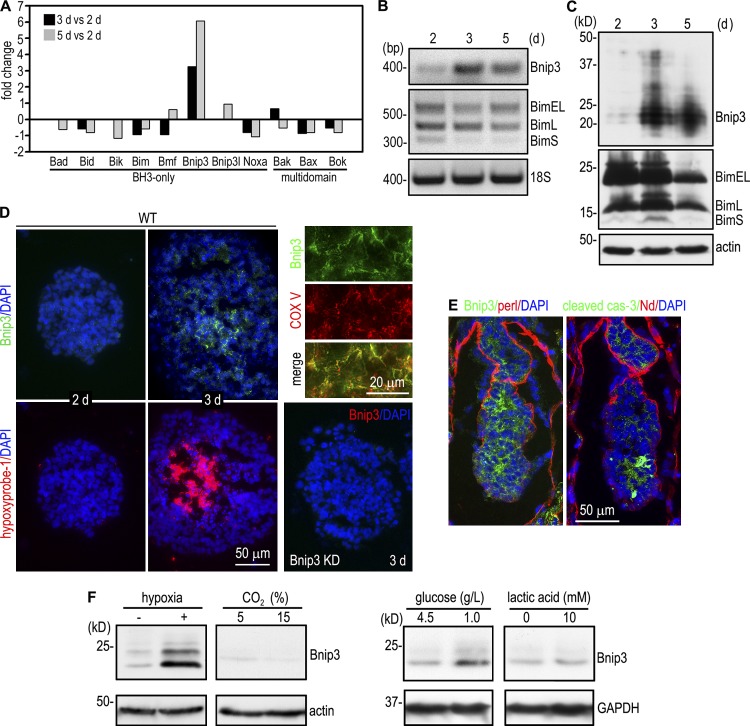
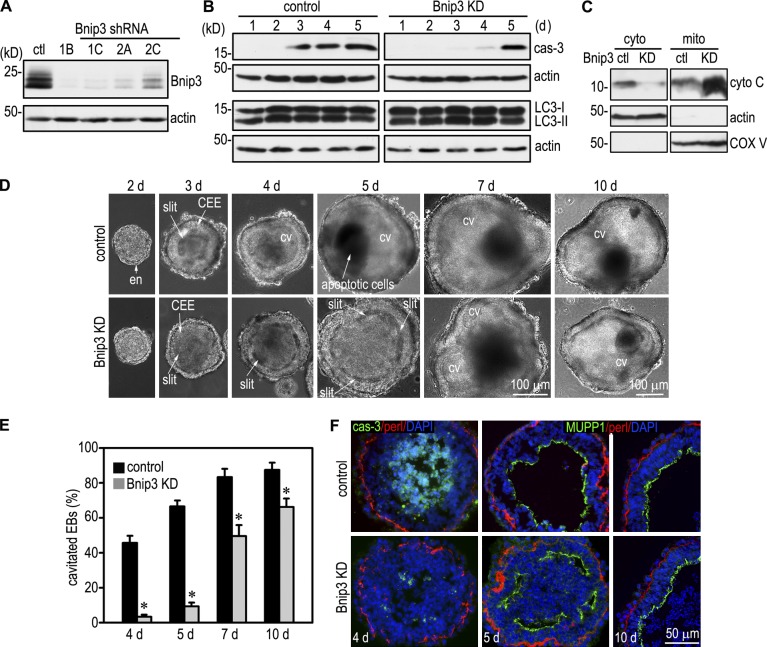
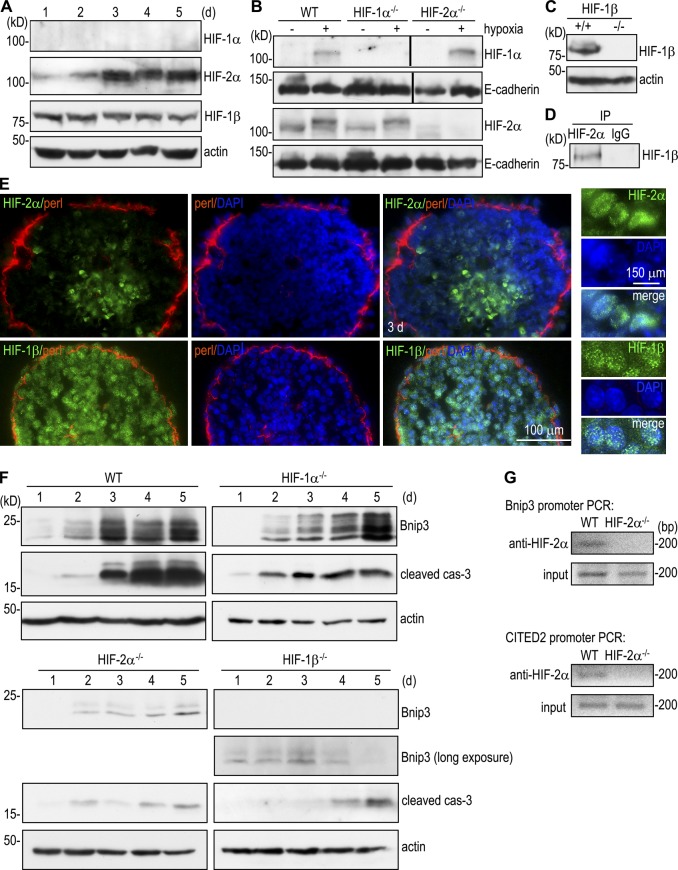
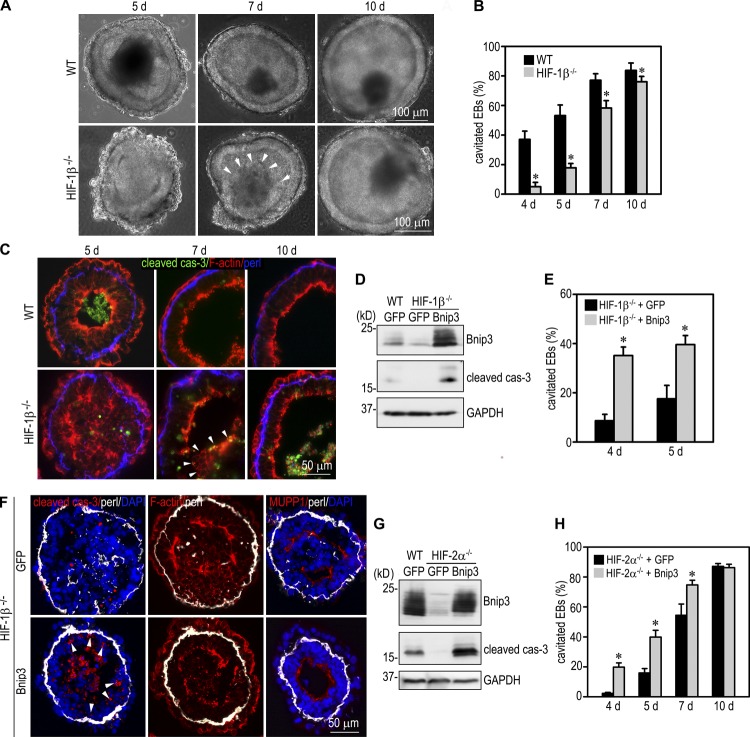
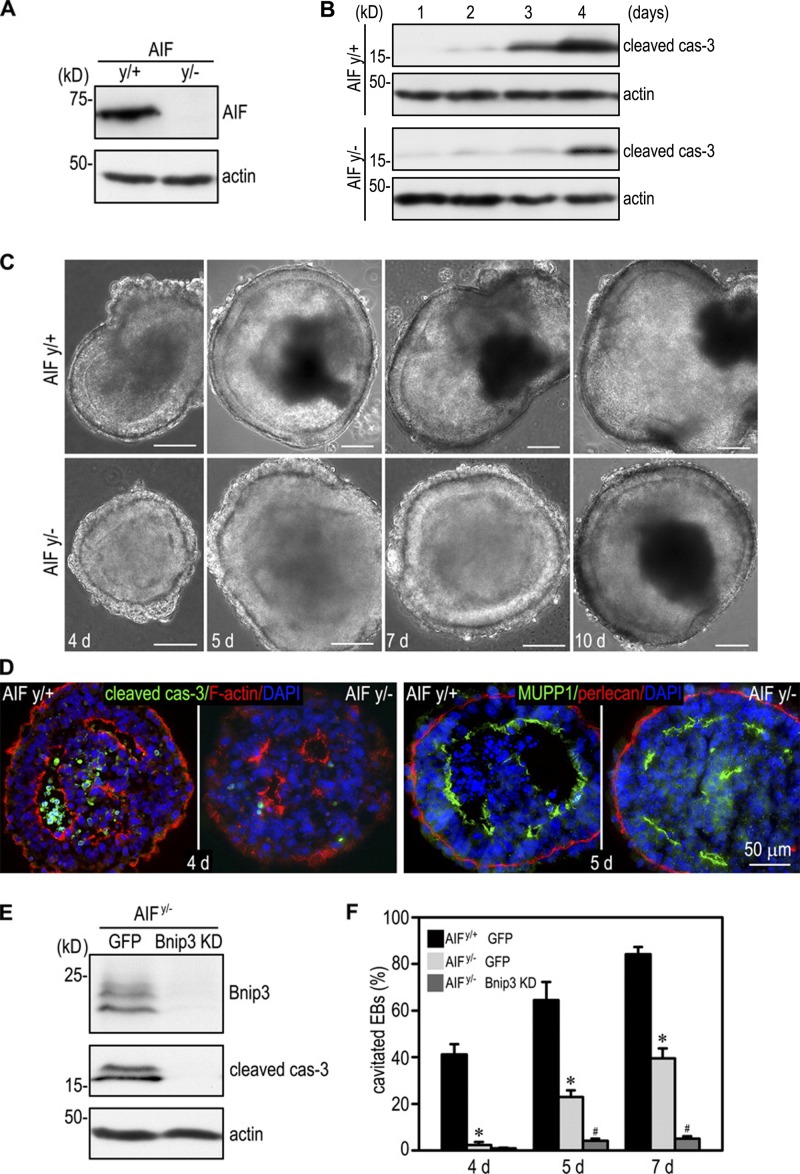
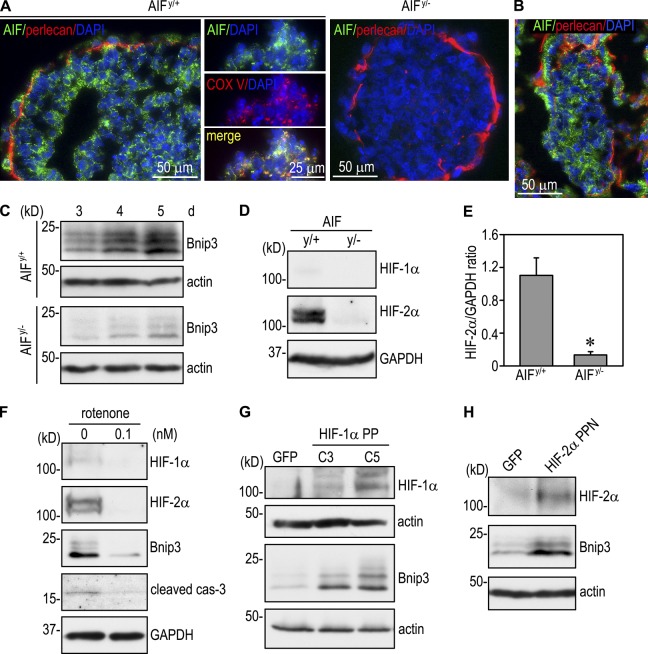
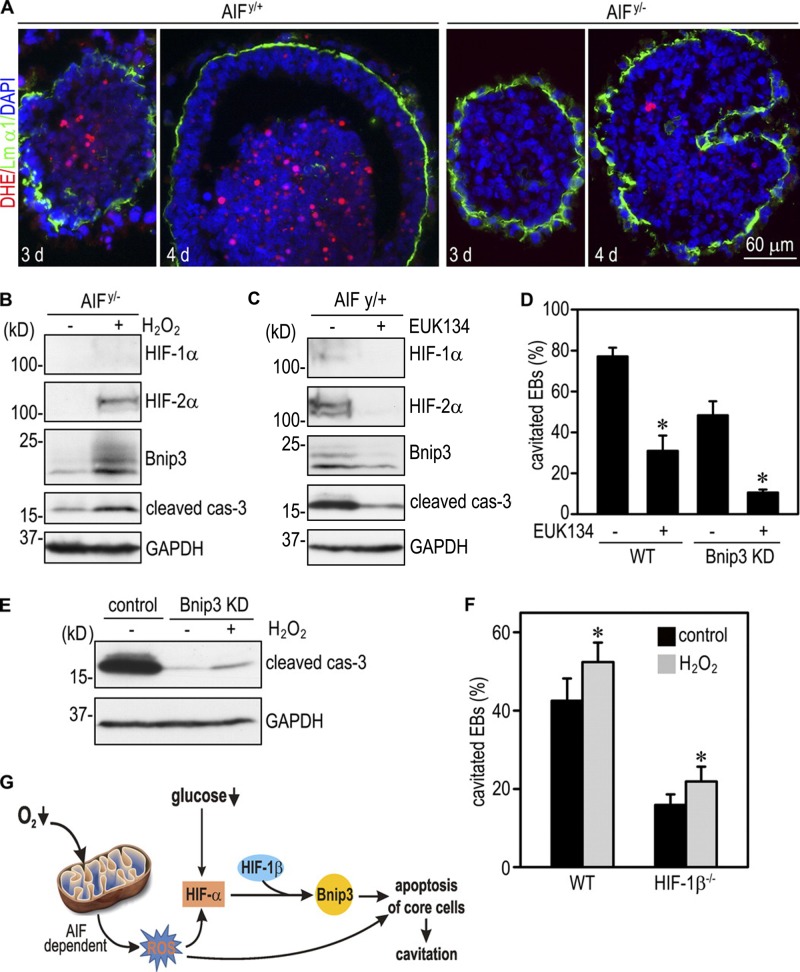
Apoptosis is an essential step in cavitation during embryonic epithelial morphogenesis, but its mechanisms are largely unknown. In this paper, we used embryonic stem cell-differentiated embryoid bodies (EBs) as a model and found that Bnip3 (Bcl-2/adenovirus E1B 19-kD interacting protein), a BH3-only proapoptotic protein, was highly up-regulated during cavitation in a hypoxia-dependent manner. Short hairpin RNA silencing of Bnip3 inhibited apoptosis of the core cells and delayed cavitation. We show that the Bnip3 up-regulation was mediated mainly by hypoxia-inducible factor (HIF)-2. Ablation of HIF-2α or HIF-1β, the common β subunit of HIF-1 and -2, suppressed Bnip3 up-regulation and inhibited apoptosis and cavitation. We further show that apoptosis-inducing factor (AIF) cooperated with Bnip3 to promote lumen clearance. Bnip3 silencing in AIF-null EBs nearly blocked apoptosis and cavitation. Moreover, AIF also regulated Bnip3 expression through mitochondrial production of reactive oxygen species and consequent HIF-2α stabilization. These results uncover a mechanism of cavitation through hypoxia-induced apoptosis of the core cells mediated by HIFs, Bnip3, and AIF.


Figures

Figure 1.
Figure 1.
Bnip3 is selectively up-regulated during embryonic epithelial morphogenesis. (A) Microarray analysis of mRNAs for BH domain–containing proapoptotic proteins revealed selective up-regulation of Bnip3 during EB differentiation. The data shown are the mean of two detections. (B) RT-PCR analysis showed that the mRNA for Bnip3 but not Bim was increased during EB differentiation. (C) Normal EBs cultured for 2, 3, and 5 d were analyzed by immunoblotting for Bnip3 and Bim. Actin serves as a loading control. Bnip3 expression was significantly increased in 3- and 5-d EBs. (D) 2- and 3-d EBs were incubated with 10 µM hypoxyprobe-1 for 2 h and immunostained for Bnip3 and hypoxyprobe-1. A central hypoxic zone was evident in 3-d EBs. Bnip3 was mainly expressed in the cells in or near the hypoxic zone. Bnip3 knockdown (KD) EBs served as a negative control for Bnip3 staining. 3-d EBs were also costained for Bnip3 and the mitochondrial marker complex V (COX V). Bnip3 colocalized with complex V. (E) E5.0 mouse embryos were immunostained for Bnip3, cleaved caspase-3 (cas-3), and the basement membrane proteins perlecan (perl) and nidogen (Nd). (F) 1-d EBs were cultured at 37°C for 16 h under the following conditions: in hypoxic pouches (GasPak EZ; BD), under 5% (pH 7.2) or 15% CO2 (pH 6.7), in media containing 4.5 g/L or 1.0 g/L glucose, and in media with (pH 6.7) or without (pH 7.2) 10 mM lactic acid. EBs were analyzed by immunoblotting for Bnip3, actin, and glyceraldehyde 3-phosphate dehydrogenase (GAPDH). Hypoxia significantly up-regulated Bnip3 expression, whereas low glucose led to a moderate increase.
Figure 2.
Figure 2.
Bnip3 knockdown inhibits apoptosis and cavitation. (A) Stable ES cell clones expressing Bnip3 shRNAs or the scrambled control (ctl) were established based on puromycin resistance and GFP fluorescence. Immunoblot analysis of 3-d EBs showed a reduction of Bnip3 expression by 97% in clone 1B. (B) Bnip3 knockdown (KD; clone 1B) and control EBs were cultured for 1–5 d and analyzed by immunoblotting for cleaved caspase-3 (cas-3), microtubule-associated protein 1 LC3, and actin. Bnip3 knockdown inhibited caspase-3 activation but not the conversion of LC3-I to LC3-II. (C) Cytosolic (cyto) and mitochondrial (mito) preparations of 3-d control and Bnip3 knockdown EBs were analyzed by immunoblotting for cytochrome C (cyto C). Actin serves as a cytosolic loading control, and complex V (COX V) serves as a mitochondrial loading control. Bnip3 knockdown inhibited cytochrome C release from the mitochondria to the cytoplasm. (D) Live-phase micrographs show the differentiation of endoderm (en) and the CEE and the formation of a proamniotic-like cavity (CV). Bnip3 knockdown significantly delayed the clearance of centrally located cells. (E) EBs with a central cavity were counted by live-phase microscopy and plotted as a percentage of total EBs examined. n = 7 independent experiments with a total of 1,387–1,906 EBs for each group. Error bars represent the mean ± SD. *, P < 0.01. (F) EBs were cultured for 4, 5, and 10 d and immunostained for cleaved caspase-3, the apical polarity marker MUPP1, and basement membrane perlecan (perl). The nucleus was counterstained with DAPI. Bnip3 knockdown inhibited apoptosis and delayed lumen clearance but had no effect on epiblast polarity.
Figure 3.
Figure 3.
HIFs mediate Bnip3 up-regulation and apoptosis. (A) Immunoblot analysis of normal EBs cultured for 1–5 d showed that HIF-2α was selectively up-regulated during EB differentiation. (B) 1-d EBs were cultured in hypoxic pouches for 16 h and then analyzed by immunoblotting for HIF-1α and -2α. HIF-1α and -2α were absent from HIF-1α−/− and HIF-2α−/− EBs, respectively. Black lines indicate that intervening lanes have been spliced out. WT, wild type. (C) Immunoblots show that HIF-1β was not expressed in HIF-1β−/− EBs. (D) Nuclear lysates of 3-d normal EBs were immunoprecipitated (IP) with HIF-2α antibody or control IgG followed by immunoblotting for HIF-1β. HIF-2α coimmunoprecipitated with HIF-1β. (E) Immunostaining showed that HIF-2α was localized to the nucleus of the core cells of 3-d EBs, whereas HIF-1β was detected in the nucleus of all cells. perl, perlecan. (F) EBs were cultured for 1–5 d and analyzed for Bnip3 and cleaved caspase-3 (cas-3) by immunoblotting. Bnip3 was significantly up-regulated during EB differentiation in wild-type and HIF-1α−/− EBs but was only minimally induced in HIF-2α−/− and HIF-1β−/− EBs. The level of cleaved caspase-3 correlated with that of Bnip3. (G) ChIP of HIF-2α interactions with the Bnip3 and CITED2 promoters. Bands are PCR products targeting −308 to −101 of the Bnip3 promoter and −1,512 to −1,329 of CITED2 promoter. HIF-2α specifically interacted with the Bnip3 promoter. CITED2 ChIP was used as a positive control.
Figure 4.
Figure 4.
HIFs promote cavitation through Bnip3. (A) Live-phase micrographs show a delay in cavitation in HIF-1β−/− EBs. Arrowheads indicate the remaining core of a 7-d mutant EB. WT, wild type. (B) EBs with a central cavity were counted and plotted as a percentage of total EBs examined. n = 10 independent experiments with a total of 856–932 EBs for each group. Error bars represent the mean ± SD. *, P < 0.01. (C) Immunostaining for cleaved caspase-3 (cas-3) revealed reduced central apoptosis in 5-d HIF-1β−/− EBs. Arrowheads indicate the remaining core of a 7-d mutant EB. perl, perlecan. (D) Wild-type EBs stably transfected with GFP and HIF-1β−/− EBs transfected with Bnip3 or GFP were cultured for 2 d and subjected to immunoblotting for Bnip3 and cleaved caspase-3. Glyceraldehyde 3-phosphate dehydrogenase (GAPDH) serves as a loading control. Overexpression of Bnip3 increased apoptosis in HIF-1β−/− EBs. (E) HIF-1β−/− EBs transfected with Bnip3 or GFP were cultured for 4 and 5 d and examined by live-phase microscopy. The percentage of EBs with a central cavity was plotted. n = 8 independent experiments with a total of 952–1,114 EBs for each group. Error bars represent the mean ± SD. *, P < 0.01. (F) 5-d EBs were immunostained for cleaved caspase-3, MUPP1, and perlecan. F-actin was stained with rhodamine-phalloidin. Overexpression of Bnip3 in HIF-1β−/− EBs promoted central apoptosis and cavitation. It also caused apoptosis of the epiblast cells in contact with the basement membrane (arrowheads). (G) Wild-type GFP EBs and HIF-2α−/− EBs transfected with Bnip3 or GFP were cultured for 3 d and subjected to immunoblotting for Bnip3 and cleaved caspase-3. Overexpression of Bnip3 increased apoptosis in HIF-2α−/− EBs. (H) The cavitation efficiency of HIF-2α−/− EBs expressing Bnip3 or GFP was counted and plotted. n = 9–23 independent experiments with a total of 900–2,270 EBs for each group. Error bars represent the mean ± SD. *, P < 0.01.
Figure 5.
Figure 5.
Bnip3 cooperates with AIF to induce apoptosis and cavitation. (A) 4-d AIFy/+ and AIFy/− EBs were analyzed by immunoblotting for AIF. Actin was used as a loading control. (B) EBs were cultured for 1–4 d and analyzed by immunoblotting for cleaved caspase-3 (cas-3) and actin. Ablation of AIF inhibited caspase-3 activation. (C) Live-phase micrographs show cavitation delay in AIFy/− EBs cultured for 4, 5, and 7 d. After 10 d, most of the AIFy/− EBs were cavitated similar to AIFy/+ EBs. Bars, 100 µm. (D) 4-d EBs were immunostained for cleaved caspase-3. F-actin was stained with rhodamine-phalloidin to show the apical actin belt. Ablation of AIF inhibited apoptosis of the core cells. 5-d EBs were immunostained for the apical marker MUPP1. Apical polarization of the AIFy/− epiblast was not affected despite delayed lumen clearance. (E) AIFy/− ES cells were stably transfected with Bnip3 shRNA (Bnip3 knockdown [KD]) or GFP. 5-d EBs were analyzed by immunoblotting for Bnip3 and cleaved caspase-3. Bnip3 silencing in AIFy/− EBs further inhibited caspase-3 activation. (F) AIFy/+ EBs expressing GFP and AIFy/− EBs stably transfected with Bnip3 shRNA or GFP were cultured for 4, 5, and 7 d. EB cavitation was quantitated by phase microscopy. EB cavitation was significantly delayed in the absence of AIF. Knockdown of Bnip3 in AIFy/− EBs nearly blocked cavitation. n = 6 independent experiments with a total of 529–808 EBs counted for each group. Error bars represent the mean ± SD. *, P < 0.01 versus AIFy/+ GFP; #, P < 0.01 versus AIFy/− GFP.
Figure 6.
Figure 6.
Mitochondrial AIF regulates Bnip3 expression by stabilizing HIF-α. (A) 4-d AIFy/+ and AIFy/− EBs were stained for AIF and basement membrane perlecan. Nuclei were counterstained with DAPI. AIF was expressed in a punctate pattern in both polarized epiblast cells and core cells. AIF was not observed in the nucleus of the core cells undergoing apoptosis. The middle images show costaining of the core cells for AIF and mitochondrial complex V (COX V) in AIFy/+ EBs. AIF colocalized with complex V. AIFy/− EBs were used as a negative control for AIF staining. (B) E5.0 embryos were immunostained for AIF and perlecan. AIF was expressed in both endoderm and epiblast. (C) AIFy/+ and AIFy/− EBs were cultured for 3–5 d and analyzed for Bnip3 by immunoblotting. Bnip3 expression was significantly reduced in the absence of AIF. (D) Immunoblots show that the level of HIF-2α was much lower in 3-d AIFy/− EBs than in AIFy/+ EBs. GAPDH, glyceraldehyde 3-phosphate dehydrogenase. (E) The blots were analyzed by densitometry, and the ratio of HIF-2α to glyceraldehyde 3-phosphate dehydrogenase was plotted. n = 4. Error bars represent the mean ± SD. *, P < 0.01. (F) Normal EBs were cultured in the presence or absence of 0.1 nM of the mitochondria complex I inhibitor rotenone for 3 d. Immunoblots show that rotenone treatment reduced the expression of HIF-1α, HIF-2α, Bnip3, and cleaved caspase-3 (cas-3). (G) AIFy/− EBs were stably transfected with GFP or mutant HIF-1α PP that is stable under normoxia but still binds to DNA and activates transcription. Expression of HIF-1α PP (clones C3 and C5) increased Bnip3 levels. (H) Immunoblots show that AIFy/− EBs stably expressing mutant HIF-2α PPN that is stable in normoxia led to Bnip3 up-regulation compared with the EBs expressing GFP. Actin serves as a loading control.
Figure 7.
Figure 7.
ROS mediate AIF-dependent HIF-α stabilization, Bnip3 elevation, apoptosis, and cavitation. (A) 3- and 4-d EBs were incubated with 60 nM DHE for 30 min and fixed in 3% PFA for 10 min. Basement membrane was stained with anti–laminin α1 antibody (Lm α1). DHE strongly labeled the centrally located cells in AIFy/+ EBs, whereas DHE fluorescence was much weaker in AIFy/− EBs. (B) 2-d AIFy/− EBs were incubated with or without 0.1 mM H2O2 for 24 h and harvested for immunoblot analysis. H2O2 treatment led to a marked increase of HIF-2α, Bnip3, and cleaved caspase-3 (cas-3). GAPDH, glyceraldehyde 3-phosphate dehydrogenase. (C) 2-d AIFy/+ EBs were treated with or without 2 µM EUK134 for 24 h. Immunoblots show that EUK134 treatment reduced the expression of HIF-1α, HIF-2α, Bnip3, and cleaved caspase-3. (D) 2-d wild-type (WT) and Bnip3 knockdown (KD) EBs were cultured with or without 2 µM EUK134 for an additional 5 d. EB cavitation was quantitated by phase microscopy. Cavitation of normal EBs was inhibited by EUK134 treatment. The cavitation efficiency was lower in Bnip3 knockdown EBs and was further reduced by EUK134 treatment. n = 6 independent experiments with a total of 634–753 EBs for each group. Error bars represent the mean ± SD. *, P < 0.01 versus EUK134 untreated group. (E) 2-d control and Bnip3 knockdown EBs were incubated with or without 0.1 mM H2O2 for 24 h and analyzed by immunoblotting for cleaved caspase-3. Bnip3 silencing markedly reduced cleaved caspase-3, whereas H2O2 treatment slightly increased its level. (F) 1-d EBs were treated with or without 0.1 mM H2O2 for 3 d. H2O2 treatment slightly increased the cavitation efficiency of both wild-type and HIF-1β−/− EBs. n = 9 independent experiments with a total of 909–1,004 EBs counted for each group. Error bars represent the mean ± SD. *, P < 0.01 versus control. (G) A model for EB cavitation. Hypoxia increases ROS production by mitochondria of the core cells in an AIF-dependent manner. Increased ROS and reduced glucose availability lead to HIF-2α stabilization and subsequent transactivation of Bnip3 expression. In turn, Bnip3 induces apoptosis of the core cells and cavitation. ROS can additionally trigger apoptosis independent of Bnip3.

Similar articles

Cited by

References

    1. Arteel G.E., Thurman R.G., Yates J.M., Raleigh J.A. 1995. Evidence that hypoxia markers detect oxygen gradients in liver: Pimonidazole and retrograde perfusion of rat liver. Br. J. Cancer. 72:889–895 10.1038/bjc.1995.429 - DOI - PMC - PubMed
    1. Brown D., Yu B.D., Joza N., Bénit P., Meneses J., Firpo M., Rustin P., Penninger J.M., Martin G.R. 2006. Loss of Aif function causes cell death in the mouse embryo, but the temporal progression of patterning is normal. Proc. Natl. Acad. Sci. USA. 103:9918–9923 10.1073/pnas.0603950103 - DOI - PMC - PubMed
    1. Bruick R.K. 2000. Expression of the gene encoding the proapoptotic Nip3 protein is induced by hypoxia. Proc. Natl. Acad. Sci. USA. 97:9082–9087 10.1073/pnas.97.16.9082 - DOI - PMC - PubMed
    1. Brunelle J.K., Bell E.L., Quesada N.M., Vercauteren K., Tiranti V., Zeviani M., Scarpulla R.C., Chandel N.S. 2005. Oxygen sensing requires mitochondrial ROS but not oxidative phosphorylation. Cell Metab. 1:409–414 10.1016/j.cmet.2005.05.002 - DOI - PubMed
    1. Brusselmans K., Bono F., Maxwell P., Dor Y., Dewerchin M., Collen D., Herbert J.M., Carmeliet P. 2001. Hypoxia-inducible factor-2alpha (HIF-2alpha) is involved in the apoptotic response to hypoglycemia but not to hypoxia. J. Biol. Chem. 276:39192–39196 10.1074/jbc.C100428200 - DOI - PubMed

Publication types

MeSH terms

Substances