

Dominance of the CD4(+) T helper cell response during acute resolving hepatitis A virus infection
- PMID: 22753925
- PMCID: PMC3409494
- DOI: 10.1084/jem.20111906
Dominance of the CD4(+) T helper cell response during acute resolving hepatitis A virus infection
Abstract
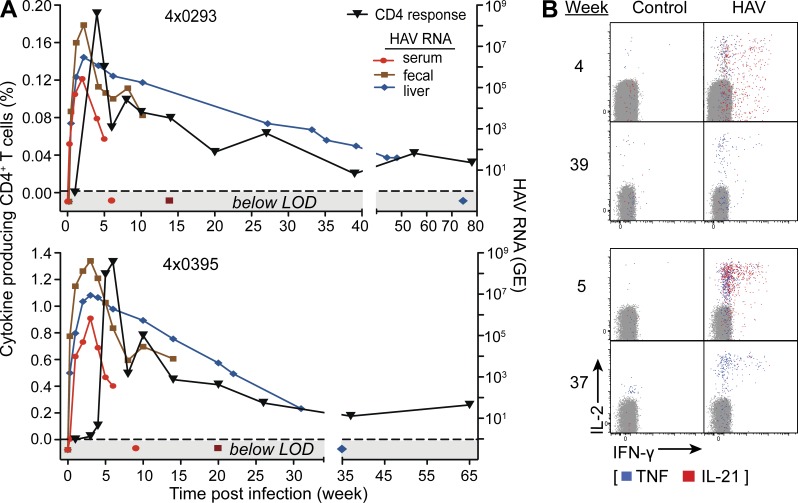
Hepatitis A virus (HAV) infection typically resolves within 4-7 wk but symptomatic relapse occurs in up to 20% of cases. Immune mechanisms that terminate acute HAV infection, and prevent a relapse of virus replication and liver disease, are unknown. Here, patterns of T cell immunity, virus replication, and hepatocellular injury were studied in two HAV-infected chimpanzees. HAV-specific CD8(+) T cells were either not detected in the blood or failed to display effector function until after viremia and hepatitis began to subside. The function of CD8(+) T cells improved slowly as the cells acquired a memory phenotype but was largely restricted to production of IFN-γ. In contrast, CD4(+) T cells produced multiple cytokines when viremia first declined. Moreover, only CD4(+) T cells responded during a transient resurgence of fecal HAV shedding. This helper response then contracted slowly over several months as HAV genomes were eliminated from liver. The findings indicate a dominant role for CD4(+) T cells in the termination of HAV infection and, possibly, surveillance of an intrahepatic reservoir of HAV genomes that decays slowly. Rapid contraction or failure to sustain such a CD4(+) T cell response after resolution of symptoms could increase the risk of relapsing hepatitis A.
Figures


Similar articles
-
Reassessing immune control of hepatitis A virus.Curr Opin Virol. 2015 Apr;11:7-13. doi: 10.1016/j.coviro.2015.01.003. Epub 2015 Jan 21. Curr Opin Virol. 2015. PMID: 25617494 Free PMC article. Review.
-
Macrophage Depletion Reactivates Fecal Virus Shedding following Resolution of Acute Hepatitis A in Ifnar1-/- Mice.J Virol. 2022 Dec 14;96(23):e0149622. doi: 10.1128/jvi.01496-22. Epub 2022 Nov 10. J Virol. 2022. PMID: 36354341 Free PMC article.
-
Acute hepatitis A virus infection is associated with a limited type I interferon response and persistence of intrahepatic viral RNA.Proc Natl Acad Sci U S A. 2011 Jul 5;108(27):11223-8. doi: 10.1073/pnas.1101939108. Epub 2011 Jun 20. Proc Natl Acad Sci U S A. 2011. PMID: 21690403 Free PMC article.
-
Redefining the immune landscape of hepatitis A virus infection.Exp Mol Med. 2025 Apr;57(4):714-723. doi: 10.1038/s12276-025-01431-2. Epub 2025 Apr 2. Exp Mol Med. 2025. PMID: 40175697 Free PMC article. Review.
-
TIM1 (HAVCR1) Is Not Essential for Cellular Entry of Either Quasi-enveloped or Naked Hepatitis A Virions.mBio. 2017 Sep 5;8(5):e00969-17. doi: 10.1128/mBio.00969-17. mBio. 2017. PMID: 28874468 Free PMC article.
Cited by
-
Reassessing immune control of hepatitis A virus.Curr Opin Virol. 2015 Apr;11:7-13. doi: 10.1016/j.coviro.2015.01.003. Epub 2015 Jan 21. Curr Opin Virol. 2015. PMID: 25617494 Free PMC article. Review.
-
CD8α dendritic cells drive establishment of HSV-1 latency.PLoS One. 2014 Apr 2;9(4):e93444. doi: 10.1371/journal.pone.0093444. eCollection 2014. PLoS One. 2014. PMID: 24695322 Free PMC article.
-
Presentation of hepatocellular antigens.Cell Mol Immunol. 2016 May;13(3):293-300. doi: 10.1038/cmi.2015.109. Epub 2016 Feb 29. Cell Mol Immunol. 2016. PMID: 26924525 Free PMC article. Review.
-
Viral protease cleavage of MAVS in genetically modified mice with hepatitis A virus infection.J Hepatol. 2023 Feb;78(2):271-280. doi: 10.1016/j.jhep.2022.09.013. Epub 2022 Sep 22. J Hepatol. 2023. PMID: 36152761 Free PMC article.
-
Immune responses and immunopathology in acute and chronic viral hepatitis.Nat Rev Immunol. 2016 Aug;16(8):509-23. doi: 10.1038/nri.2016.69. Epub 2016 Jul 4. Nat Rev Immunol. 2016. PMID: 27374637 Review.
References
-
- Aichele P., Unsoeld H., Koschella M., Schweier O., Kalinke U., Vucikuja S. 2006. CD8 T cells specific for lymphocytic choriomeningitis virus require type I IFN receptor for clonal expansion. J. Immunol. 176:4525–4529 - PubMed
Publication types
MeSH terms
Substances
Grants and funding
- R01 OD011095/OD/NIH HHS/United States
- C06 RR016228/RR/NCRR NIH HHS/United States
- R37 AI028433/AI/NIAID NIH HHS/United States
- R01 AI028433/AI/NIAID NIH HHS/United States
- P51 RR13986/RR/NCRR NIH HHS/United States
- P51 OD011133/OD/NIH HHS/United States
- C06 RR012087/RR/NCRR NIH HHS/United States
- R37 AI047367/AI/NIAID NIH HHS/United States
- P51 RR013986/RR/NCRR NIH HHS/United States
- C06 RR12087/RR/NCRR NIH HHS/United States
- C06RR16228/RR/NCRR NIH HHS/United States
- R37-AI028433/AI/NIAID NIH HHS/United States
- U19 AI040035/AI/NIAID NIH HHS/United States
- U19 AI40035/AI/NIAID NIH HHS/United States
- OD011095/OD/NIH HHS/United States
LinkOut - more resources
Full Text Sources
Other Literature Sources
Medical
Research Materials
