. 2012 Aug 1;189(3):1253-64.
doi: 10.4049/jimmunol.1200623. Epub 2012 Jun 29.

Transcription factor zinc finger and BTB domain 1 is essential for lymphocyte development

Affiliations

Transcription factor zinc finger and BTB domain 1 is essential for lymphocyte development

Divya Punwani et al. J Immunol. .

Abstract

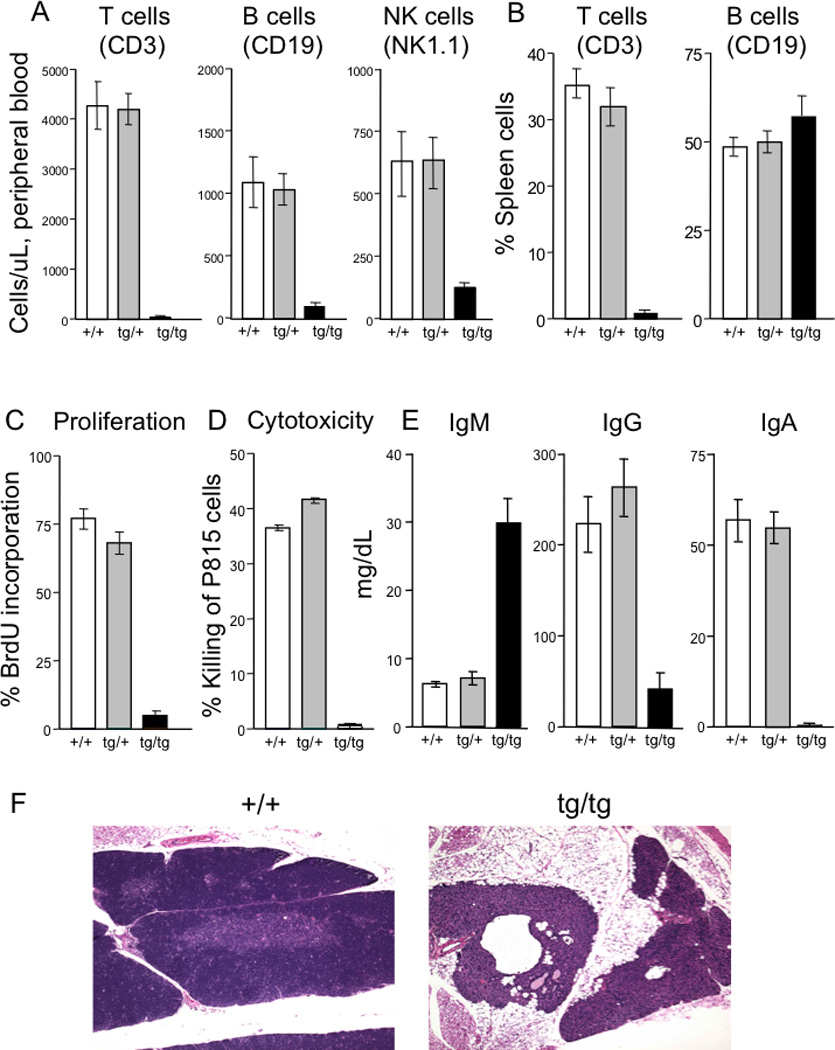
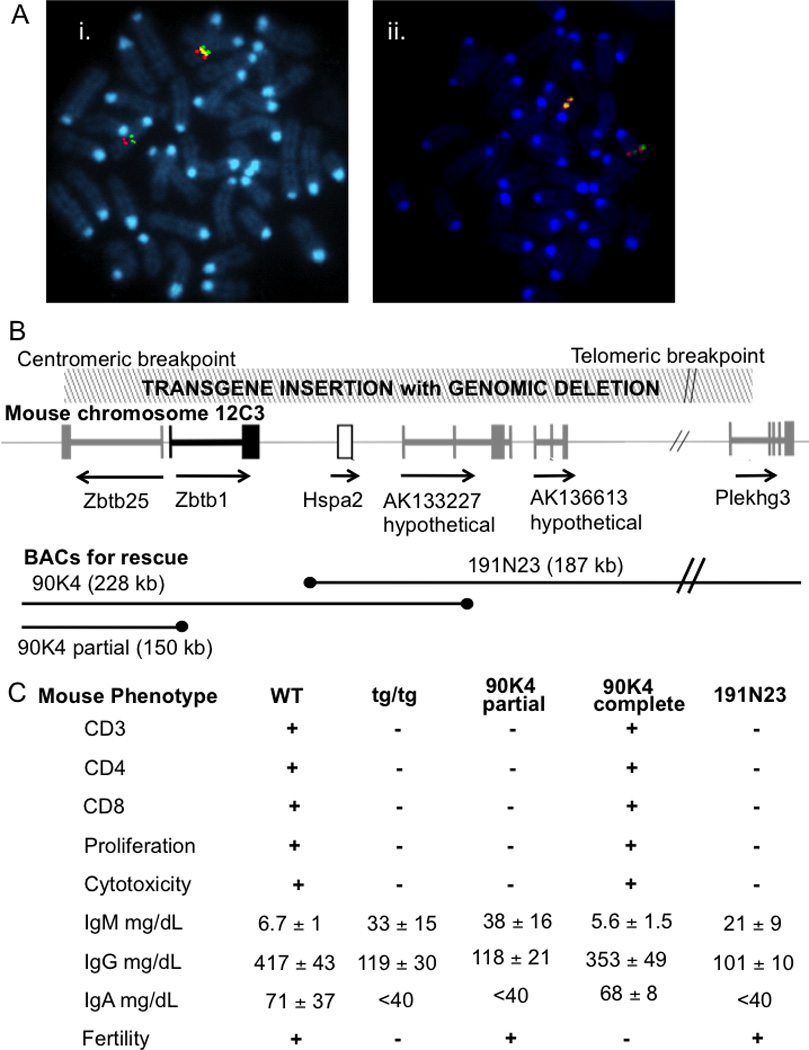
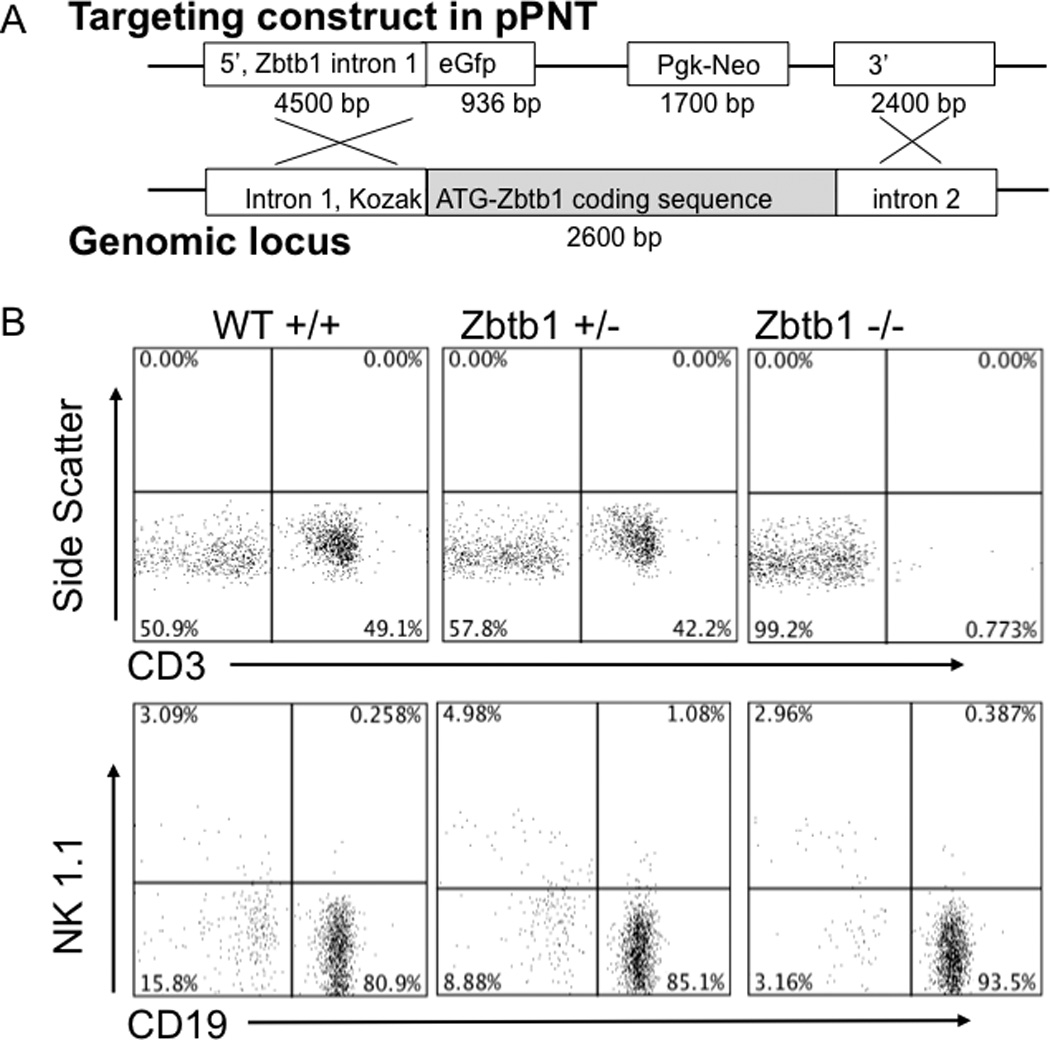
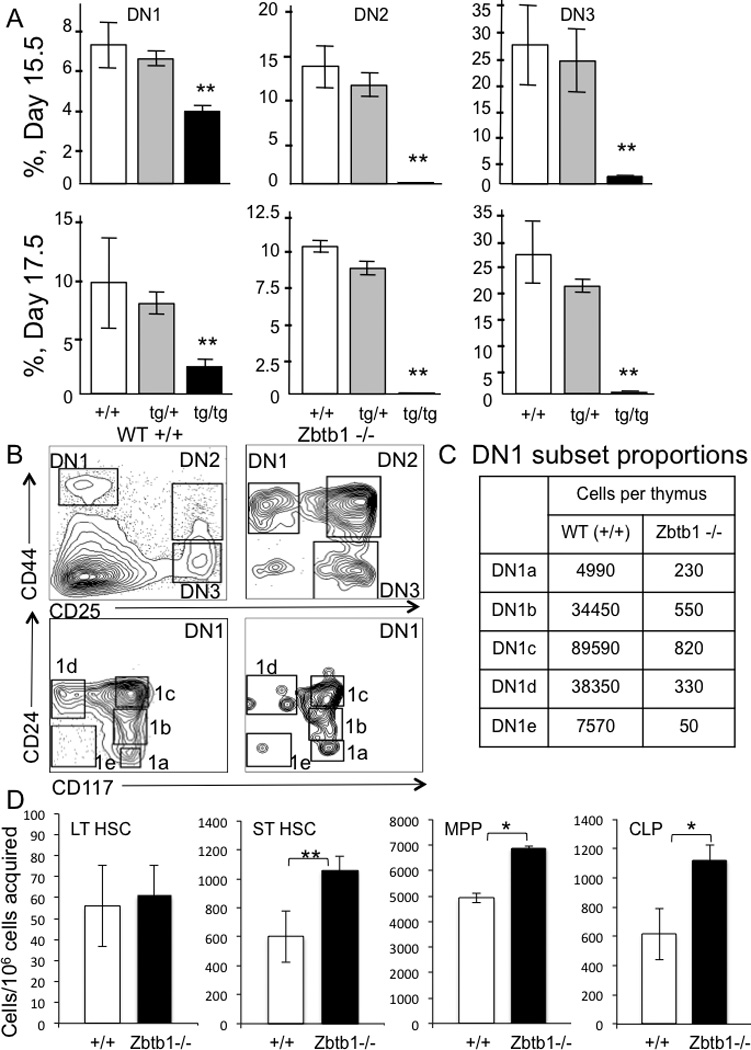
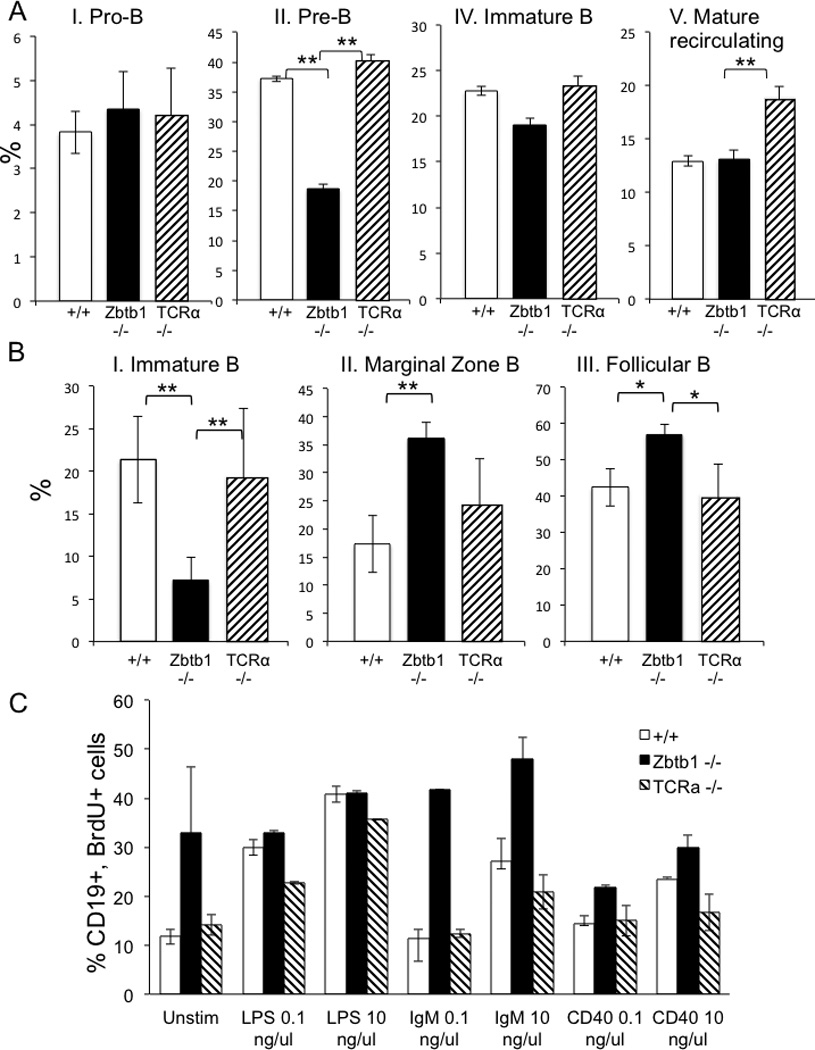
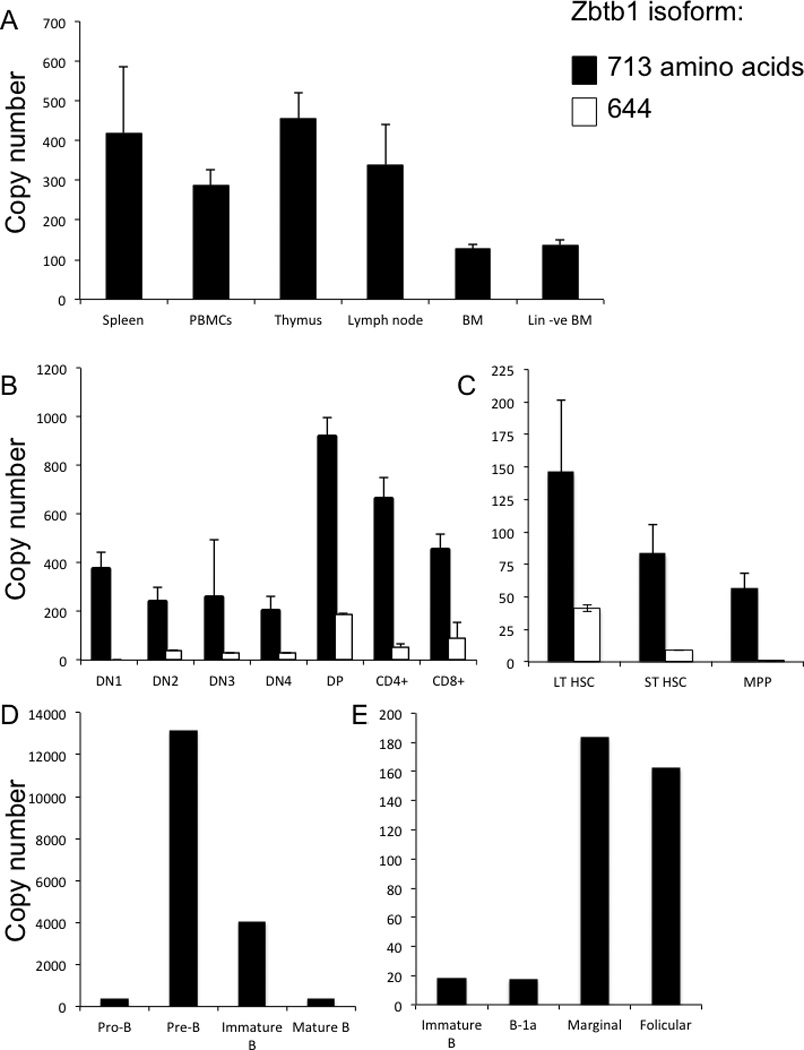
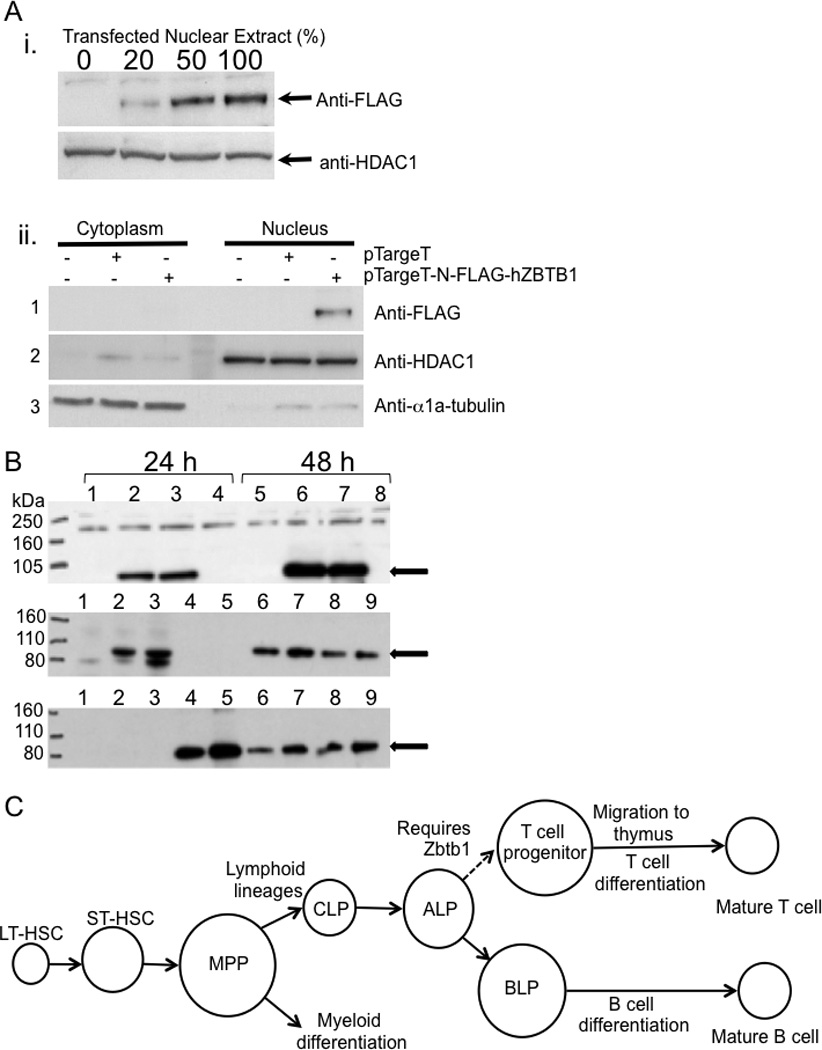
Absent T lymphocytes were unexpectedly found in homozygotes of a transgenic mouse from an unrelated project. T cell development did not progress beyond double-negative stage 1 thymocytes, resulting in a hypocellular, vestigial thymus. B cells were present, but NK cell number and B cell isotype switching were reduced. Transplantation of wild-type hematopoietic cells corrected the defect, which was traced to a deletion involving five contiguous genes at the transgene insertion site on chromosome 12C3. Complementation using bacterial artificial chromosome transgenesis implicated zinc finger BTB-POZ domain protein 1 (Zbtb1) in the immunodeficiency, confirming its role in T cell development and suggesting involvement in B and NK cell differentiation. Targeted disruption of Zbtb1 recapitulated the T(-)B(+)NK(-) SCID phenotype of the original transgenic animal. Knockouts for Zbtb1 had expanded populations of bone marrow hematopoietic stem cells and also multipotent and early lymphoid lineages, suggesting a differentiation bottleneck for common lymphoid progenitors. Expression of mRNA encoding Zbtb1, a predicted transcription repressor, was greatest in hematopoietic stem cells, thymocytes, and pre-B cells, highlighting its essential role in lymphoid development.


Figures

Figure 1
Figure 1. Characterization of homozygous transgenic mice
A, peripheral blood, and B, splenic, lymphocyte subsets from wild type (+/+), heterozygous (tg/+) and homozygous transgenic (tg/tg) mice. C, proliferation of splenic T cells after ConA stimulation, measured by BrdU incorporation. D, killing of P815 target cells. E, serum immunoglobulin levels. F, thymus histology of wild type (+/+) compared to homozygous transgenic (tg/tg) mice.
Figure 2
Figure 2. Mapping and identification of the genetic locus for immunodeficiency
A, FISH localization of tg (yellow) insertion: i. telomeric to a BAC encoding Sos2 (green) and centromeric to Psen1 (red); and ii. telomeric to Esr2 (red) and co-localizing with and replacing Hspa2 (green). B, map of mouse chromosome 12C3 showing order and direction of transcription of genes Hspa2 (open box) and Zbtb1 (black) and transcripts Zbtb25, AK133227, AK136613 and Plakhg3 (gray); hatched rectangle, above, transgene insertion/deletion region; black lines, below, BAC genomic clones (ends indicated by black dots) used for rescue transgenesis. C, immune and fertility phenotypes of wild type, original mFas tg/tg and tg/tg BAC transgenic animals containing the indicated BAC sequences, 90K4 partial, 90K4 complete, and 191N23 (mean ± SD, 6 mice/group).
Figure 3
Figure 3. Targeted disruption of Zbtb1 and characterization of knockout mice
A, gene-targeting construct, pPNT-Zbtb1 5’-eGFP-Neo-Zbtb1 3’ (15.338 Kb, above) and homologous B6 genomic target locus (below). B, peripheral blood lymphocyte phenotype of knockout transmitting founder offspring: wild type, Zbtb1 heterozygous (+/−) and Zbtb1 knockout (−/−) mice. T cells detected as CD3+; B cells, CD19+; NK cells, NK1.1+.
Figure 4
Figure 4. Analysis of thymocytes and bone marrow subsets in knockout mice
A, day 15.5 and 17.5 fetal TCRβ− CD4− CD8− double negative (DN) thymocytes in wild type +/+, heterozygous tg/+ and homozygous transgenic tg/tg mice. DN1, CD25 CD44+, DN2, CD25+ CD44+, DN3 CD25+ CD44. Percentages are means ± SD of 10 fetuses/group. B, DN subsets from adult wild type and Zbtb1 knockout mice; DN1-DN3, upper plots; subdivided DN1 (lower plots) with DN1a, CD117+ CD24; 1b, CD117+ CD24lo; 1c, CD117+ CD24+; 1d, CD117 CD24+; and 1e, CD117 CD24 [34]. C, DN1 cell subsets per thymus (n=2 per genotype). D, bone marrow cell subsets from wild type and Zbtb1 knockout mice; long term HSC (LT HSC, LSK CD34 CD48), short term HSC (ST HSC, LSK CD34+ CD48), multi potent progenitors (MPP, LSK CD34+ CD48+), common lymphoid precursors (CLP, LSK CD127+ CD135+). Data represent mean ± SD, 10 mice per group; * p < 0.05, ** p < 0.001.
Figure 5
Figure 5. Analysis of B cells of knockout mice
A, relative proportions of BM B cell subsets wild type, Zbtb1−/− and TCRα−/− mice, as defined by the Hardy and Hayakawa gating scheme: I, Pro-B (B220+ CD43+); II, Pre-B (B220+ CD43−); III, Pre-B Late (B220+ CD43 IgD IgM); IV, Immature B (B220+ CD43 IgD IgM+) V, Mature recirculating B (B220+ CD43 IgD+ IgM+). B, relative proportions of splenic B cell subsets in wild type, Zbtb1−/− and TCRα −/− mice: I, Immature B (B220+ IgDhi IgMlo CD23 CD21/35); II, Marginal zone (B220+ IgDhi IgMlo CD23lo CD21/CD35hi); III, Follicular (B220+ IgDlo IgMhi CD43 CD5 CD23hi CD21/CD35mid). Data represent mean ± SD, 4 mice per genotype; *, p< 0.1; **, p < 0.05. C, wild type, Zbtb1−/− and TCRα −/− splenic B cell proliferation after stimulation with LPS (0.1 and 10 ng/µl), anti-IgM (0.1 and 10 ng/µl) or anti-CD40 (0.1 and 10 ng/µl), measured by BrdU incorporation at 48 h.
Figure 6
Figure 6. Zbtb1 mRNA expression measured by quantitative PCR in lymphoid populations in wild type mice
A, spleen, PBMC, thymus, lymph node, bone marrow (BM), and bone marrow depleted of mature lineages (Lin –ve BM); B, thymocyte subsets, as described in Figure 4A; C, bone marrow progenitor populations, as described in Figure 4B. D and E, bone marrow and splenic B lineage subsets, as described in Figure 5; Y-axis shows copy numbers of Zbtb1 per 1000 copies of housekeeping gene HPRT. Data represent mean ± SD, 5 mice per group.
Figure 7
Figure 7. Zbtb1 protein detection by Western blotting
A, i. expression of tagged N-FLAG-hZBTB1 in nuclear extracts of transfected 293T cells. Upper panel: Anti-FLAG mAb (clone M2) detects the FLAG-tagged Zbtb1. Increasing proportions of nuclear extract from 293T cells transfected with the pTargeT-N-FLAG-hZBTB1 were mixed with extract from untreated cells, keeping the amount of protein loaded constant. The positive signal increased accordingly. Lower panel: anti-HDAC1 loading control. ii. nuclear localization of FLAG-tagged Zbtb1. Panel 1: Anti-FLAG in fractionated cytoplasmic vs. nuclear protein extracts of transfected 293T cells. Panels 2 and 3: HDAC1 and α1a-tubulin, nuclear and cytoplasmic controls, respectively. B, Western blot of 293T cell lysates 24 h (left) and 48 h (right) after transfection. Upper panel, probed with anti-FLAG antibody. Lanes: 1&5, control insert pEF-BOS-EGFP (green fluorescence to ensure efficient transfection); 2&6, N-FLAG-mZBTB1713; 3&7, C-FLAG-mZBTB1713; 4&8, plasmid with no insert. Anti-FLAG signal is at the expected 83 kDa. Middle and lower panels, hetero-dimerization after co-transfection, demonstrated by immunoprecipitation (IP) and reciprocal detection of FLAG-Zbtb1713 and myc-Zbtb1644. Lanes: 1, pEF-BOS-EGFP; 2, N-FLAG-Zbtb1713; 3, C-FLAG- mZbtb1713; 4, N-myc- Zbtb1644; 5, C-myc-Zbtb1644; 6, N-FLAG-Zbtb1713 + N-myc-Zbtb1644; 7, N-FLAG- Zbtb1713 + C-myc-mZbtb1644; 8, C-FLAG-Zbtb1713 + N-myc-Zbtb1644; 9, C-FLAG-Zbtb1713 + C-myc-Zbtb1644. C, schematic representation of an essential role of Zbtb1 during T lineage commitment.

Similar articles

Cited by

References

    1. Karsunky H, Inlay MA, Serwold T, Bhattacharya D, Weissman IL. Flk2+ common lymphoid progenitors possess equivalent differentiation potential for the B and T lineages. Blood. 2008;111(12):5562–5570. - PMC - PubMed
    1. Inlay MA, Bhattacharya D, Sahoo D, Serwold T, Seita J, Karsunky H, Plevritis SK, Dill DL, Weissman IL. Ly6d marks the earliest stage of B-cell specification and identifies the branchpoint between B-cell and T-cell development. Genes & development. 2009;23(20):2376–2381. - PMC - PubMed
    1. Wilson A, MacDonald HR, Radtke F. Notch 1-deficient common lymphoid precursors adopt a B cell fate in the thymus. The Journal of experimental medicine. 2001;194(7):1003–1012. - PMC - PubMed
    1. MacDonald HR, Wilson A, Radtke F. Notch1 and T-cell development: insights from conditional knockout mice. Trends in immunology. 2001;22(3):155–160. - PubMed
    1. Shortman K, Wu L. Early T lymphocyte progenitors. Annual review of immunology. 1996;14:29–47. - PubMed

Publication types

MeSH terms