The adjuvant LT-K63 can restore delayed maturation of follicular dendritic cells and poor persistence of both protein- and polysaccharide-specific antibody-secreting cells in neonatal mice
- PMID: 22753937
- PMCID: PMC3496199
- DOI: 10.4049/jimmunol.1200761
The adjuvant LT-K63 can restore delayed maturation of follicular dendritic cells and poor persistence of both protein- and polysaccharide-specific antibody-secreting cells in neonatal mice
Abstract
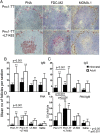
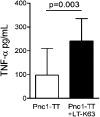
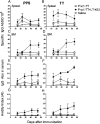
Ab responses in early life are low and short-lived; therefore, induction of protective immunity requires repeated vaccinations. One of the major limitations in early-life immunity is delayed maturation of follicular dendritic cells (FDCs), which play a central role in mediating the germinal center (GC) reaction leading to production of Ab-secreting cells (AbSCs). We assessed whether a nontoxic mutant of Escherichia coli heat-labile enterotoxin (LT-K63) and CpG1826 as model adjuvants could accelerate FDC maturation and immune response in neonatal mice, using a pneumococcal polysaccharide of serotype 1 conjugated to tetanus toxoid (Pnc1-TT) as a model vaccine. In neonatal NMRI mice, a single dose of Pnc1-TT coadministered with LT-K63 enhanced Pnc1-TT-induced GC reaction. In contrast, CpG1826 had no effect. Accordingly, LT-K63, but not CpG1826, accelerated the maturation of FDC networks, detected by FDC-M2(+) staining, characteristic for adult-like FDCs. This coincided with migration of MOMA-1(+) macrophages into the GCs that can enhance GC reaction and B cell activation. The FDC-M2(+) FDC networks colocalized with enhanced expression of TNF-α, which is critical for the maintenance of mature FDCs and is poorly expressed in neonates. The accelerated maturation of FDC networks correlated with increased frequency and prolonged persistence of polysaccharide- and protein-specific IgG(+) AbSCs in spleen and bone marrow. Our data show for the first time, to our knowledge, that an adjuvant (LT-K63) can overcome delayed maturation of FDCs in neonates, enhance the GC reaction, and prolong the persistence of vaccine-specific AbSCs in the BM. These properties are attractive for parenteral vaccination in early life.
Figures


Similar articles
-
Adjuvants Enhance the Induction of Germinal Center and Antibody Secreting Cells in Spleen and Their Persistence in Bone Marrow of Neonatal Mice.Front Immunol. 2019 Sep 26;10:2214. doi: 10.3389/fimmu.2019.02214. eCollection 2019. Front Immunol. 2019. PMID: 31616417 Free PMC article.
-
Intranasal immunization with pneumococcal conjugate vaccines with LT-K63, a nontoxic mutant of heat-Labile enterotoxin, as adjuvant rapidly induces protective immunity against lethal pneumococcal infections in neonatal mice.Infect Immun. 2002 Mar;70(3):1443-52. doi: 10.1128/IAI.70.3.1443-1452.2002. Infect Immun. 2002. PMID: 11854231 Free PMC article.
-
Effects of LT-K63 and CpG2006 on phenotype and function of murine neonatal lymphoid cells.Scand J Immunol. 2007 Oct;66(4):426-34. doi: 10.1111/j.1365-3083.2007.01970.x. Scand J Immunol. 2007. PMID: 17850587
-
Recent advances in nontoxic Escherichia coli heat-labile toxin and its derivative adjuvants.Expert Rev Vaccines. 2016 Nov;15(11):1361-1371. doi: 10.1080/14760584.2016.1182868. Epub 2016 May 12. Expert Rev Vaccines. 2016. PMID: 27118519 Review.
-
Follicular dendritic cells.J Cell Physiol. 2022 Apr;237(4):2019-2033. doi: 10.1002/jcp.30662. Epub 2021 Dec 17. J Cell Physiol. 2022. PMID: 34918359 Review.
Cited by
-
Advax delta inulin adjuvant overcomes immune immaturity in neonatal mice thereby allowing single-dose influenza vaccine protection.Vaccine. 2015 Sep 11;33(38):4892-900. doi: 10.1016/j.vaccine.2015.07.051. Epub 2015 Jul 29. Vaccine. 2015. PMID: 26232344 Free PMC article.
-
Adjuvants Enhance the Induction of Germinal Center and Antibody Secreting Cells in Spleen and Their Persistence in Bone Marrow of Neonatal Mice.Front Immunol. 2019 Sep 26;10:2214. doi: 10.3389/fimmu.2019.02214. eCollection 2019. Front Immunol. 2019. PMID: 31616417 Free PMC article.
-
Ginseng Stem-Leaf Saponins in Combination with Selenium Promote the Immune Response in Neonatal Mice with Maternal Antibody.Vaccines (Basel). 2020 Dec 11;8(4):755. doi: 10.3390/vaccines8040755. Vaccines (Basel). 2020. PMID: 33322647 Free PMC article.
-
Challenges for the Newborn Following Influenza Virus Infection and Prospects for an Effective Vaccine.Front Immunol. 2020 Sep 16;11:568651. doi: 10.3389/fimmu.2020.568651. eCollection 2020. Front Immunol. 2020. PMID: 33042150 Free PMC article. Review.
-
Synergistic induction of interferon α through TLR-3 and TLR-9 agonists stimulates immune responses against measles virus in neonatal cotton rats.Vaccine. 2014 Jan 3;32(2):265-70. doi: 10.1016/j.vaccine.2013.11.013. Epub 2013 Nov 18. Vaccine. 2014. PMID: 24262312 Free PMC article.
References
-
- WHO 2007. Pneumococcal conjugate vaccine for childhood immunization—WHO position paper. Wkly. Epidemiol. Rec. 82: 93–104 - PubMed
-
- Scott J. A. 2007. The preventable burden of pneumococcal disease in the developing world. Vaccine 25: 2398–2405 - PubMed
-
- Shahid N. S., Steinhoff M. C., Hoque S. S., Begum T., Thompson C., Siber G. R. 1995. Serum, breast milk, and infant antibody after maternal immunisation with pneumococcal vaccine. Lancet 346: 1252–1257 - PubMed
-
- Douglas R. M., Paton J. C., Duncan S. J., Hansman D. J. 1983. Antibody response to pneumococcal vaccination in children younger than five years of age. J. Infect. Dis. 148: 131–137 - PubMed
-
- Black S., Shinefield H., Fireman B., Lewis E., Ray P., Hansen J. R., Elvin L., Ensor K. M., Hackell J., Siber G. R., et al. Northern California Kaiser Permanente Vaccine Study Center Group 2000. Efficacy, safety and immunogenicity of heptavalent pneumococcal conjugate vaccine in children. Pediatr. Infect. Dis. J. 19: 187–195 - PubMed
Publication types
MeSH terms
Substances
LinkOut - more resources
Full Text Sources
Miscellaneous

