. 2012 Feb 1;40(1):529-560.
doi: 10.1214/12-AOS968.

Q-LEARNING WITH CENSORED DATA

Affiliations

Q-LEARNING WITH CENSORED DATA

Yair Goldberg et al. Ann Stat. .

Abstract

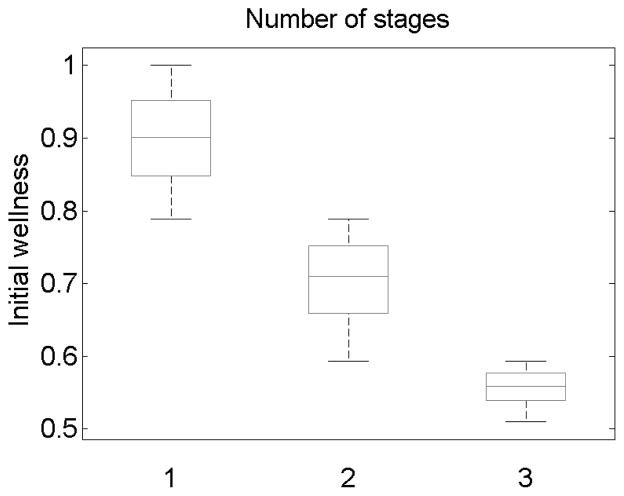
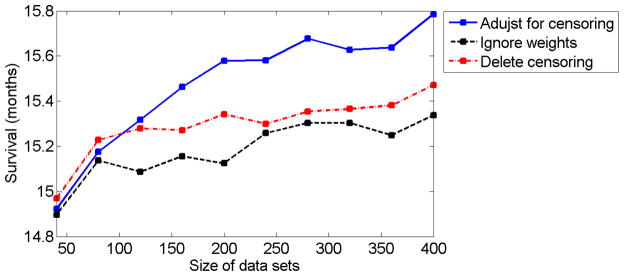
We develop methodology for a multistage-decision problem with flexible number of stages in which the rewards are survival times that are subject to censoring. We present a novel Q-learning algorithm that is adjusted for censored data and allows a flexible number of stages. We provide finite sample bounds on the generalization error of the policy learned by the algorithm, and show that when the optimal Q-function belongs to the approximation space, the expected survival time for policies obtained by the algorithm converges to that of the optimal policy. We simulate a multistage clinical trial with flexible number of stages and apply the proposed censored-Q-learning algorithm to find individualized treatment regimens. The methodology presented in this paper has implications in the design of personalized medicine trials in cancer and in other life-threatening diseases.


Figures

Fig 1
Fig 1
The solid black curve, dashed blue curve, dot-dashed red curve, and dotted green curve correspond to the expected survival time (in months) for different data set sizes with no censoring, 10% censoring, 20% censoring, and 30% censoring, respectively. The expected survival time was computed as the mean of 400 repetitions of the simulation. The black straight line, blue dashed straight line, and the dot-dashed red straight line correspond to the expected survival times of the optimal policy, the best fixed treatment policy, and the average of the fixed treatment policies, respectively.
Fig 2
Fig 2
The eight light gray bars represent the expected survival times for different fixed treatments where A1A2A3 indicates the policy that chooses Ai at the i-th stage. The four dark gray bars represent the expected survival times for policy π̂ obtained by the algorithm with no censoring, 10% censoring, 20% censoring, and 30% censoring. The white bar is the expected value of the optimal policy. The values of the fixed treatments and the optimal policy were computed analytically while the values of π̂ are the means of 400 repetitions of the simulation on 200 trajectories.
Fig 3
Fig 3
Distribution of expected survival time (in months) for different data set sizes, with no censoring, 10% censoring, 20% censoring, and 30% censoring. Each box plot is based on 400 repetitions of the simulation for each given data set size and censoring percentage.
Fig 4
Fig 4
The Q-functions computed by the proposed algorithm for a size 200 trajectory set. The left panel presents both the optimal Q-function (solid red curve) and the estimated Q-function (dashed blue curve) for different wellness levels and when treatment A is chosen. Similarly, the middle panel shows both Q-functions when treatment B is chosen. The right panel shows the optimal value function (solid red curve) and the estimated value function (dashed blue curve).
Fig 5
Fig 5
The number of required treatments for patients that follow the policy π̂, when no failure event occurs during the trial. The policy π̂ was estimated from 100 trajectories. The results were computed using a size 100, 000 testing set.
Fig 6
Fig 6
The solid blue curve, dashed black curve, and dot-dashed red curve correspond to the expected survival times (in months) for different data set sizes, for the proposed algorithm, the algorithm that ignores the weights, and the algorithm that deletes all censored trajectories, respectively. The censoring variable follows the exponential distribution with 50% censoring on average. The expected survival time was computed as the mean of 400 repetitions of the simulation.

References

    1. Anthony M, Bartlett PL. Neural Network Learning: Theoretical Foundations. Cambridge University Press; 1999.
    1. Bellman R. Dynamic Programming. Princeton University Press; 1957.
    1. Biganzoli E, Boracchi P, Mariani L, Marubini E. Feed forward neural networks for the analysis of censored survival data: A partial logistic regression approach. Statist Med. 1998;17:1169–1186. - PubMed
    1. Bitouzé D, Laurent B, Massart P. A Dvoretzky-Kiefer-Wolfowitz type inequality for the Kaplan-Meier estimator. Ann Inst H Poincaré Probab Statist. 1999;35:735–763.
    1. Chen P, Tsiatis AA. Causal inference on the difference of the restricted mean lifetime between two groups. Biometrics. 2001;57:1030–1038. - PubMed

LinkOut - more resources