

The zoom lens of attention: Simulating shuffled versus normal text reading using the SWIFT model
- PMID: 22754295
- PMCID: PMC3379738
- DOI: 10.1080/13506285.2012.670143
The zoom lens of attention: Simulating shuffled versus normal text reading using the SWIFT model
Abstract
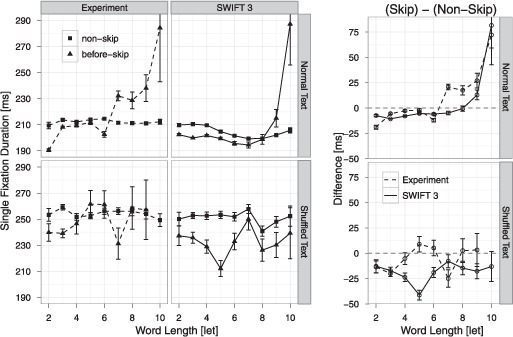
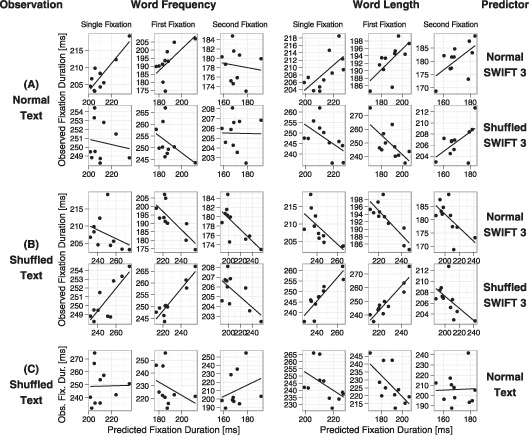
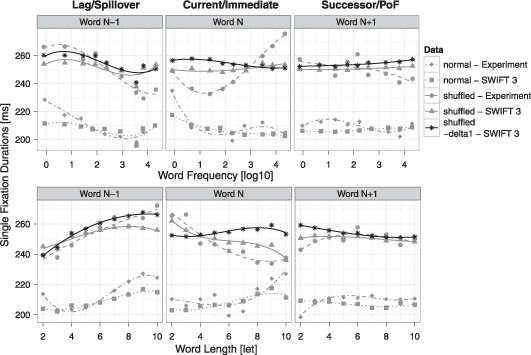
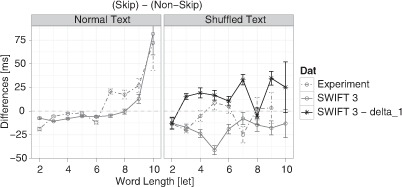
Assumptions on the allocation of attention during reading are crucial for theoretical models of eye guidance. The zoom lens model of attention postulates that attentional deployment can vary from a sharp focus to a broad window. The model is closely related to the foveal load hypothesis, i.e., the assumption that the perceptual span is modulated by the difficulty of the fixated word. However, these important theoretical concepts for cognitive research have not been tested quantitatively in eye movement models. Here we show that the zoom lens model, implemented in the SWIFT model of saccade generation, captures many important patterns of eye movements. We compared the model's performance to experimental data from normal and shuffled text reading. Our results demonstrate that the zoom lens of attention might be an important concept for eye movement control in reading.
Figures
Similar articles
-
Eye movements during reading of randomly shuffled text.Vision Res. 2010 Nov 23;50(23):2600-16. doi: 10.1016/j.visres.2010.08.005. Epub 2010 Aug 16. Vision Res. 2010. PMID: 20719240
-
A Theoretical Analysis of the Perceptual Span based on SWIFT Simulations of the n + 2 Boundary Paradigm.Vis cogn. 2014 Mar;22(3):283-308. doi: 10.1080/13506285.2014.881444. Epub 2014 Feb 28. Vis cogn. 2014. PMID: 24771996 Free PMC article.
-
Mindless reading revisited: an analysis based on the SWIFT model of eye-movement control.Vision Res. 2009 Feb;49(3):322-36. doi: 10.1016/j.visres.2008.10.022. Epub 2008 Dec 16. Vision Res. 2009. PMID: 19026673
-
SWIFT explorations of age differences in eye movements during reading.Neurosci Biobehav Rev. 2006;30(6):872-84. doi: 10.1016/j.neubiorev.2006.06.013. Epub 2006 Aug 9. Neurosci Biobehav Rev. 2006. PMID: 16904181 Review.
-
Identifying visual targets amongst interfering distractors: Sorting out the roles of perceptual load, dilution, and attentional zoom.Atten Percept Psychophys. 2016 Oct;78(7):1822-38. doi: 10.3758/s13414-016-1149-9. Atten Percept Psychophys. 2016. PMID: 27250363 Review.
Cited by
-
Evidence for direct control of eye movements during reading.J Exp Psychol Hum Percept Perform. 2013 Oct;39(5):1468-84. doi: 10.1037/a0031647. Epub 2013 Feb 18. J Exp Psychol Hum Percept Perform. 2013. PMID: 23421473 Free PMC article.
-
Analysis of spiking synchrony in visual cortex reveals distinct types of top-down modulation signals for spatial and object-based attention.PLoS Comput Biol. 2021 Mar 25;17(3):e1008829. doi: 10.1371/journal.pcbi.1008829. eCollection 2021 Mar. PLoS Comput Biol. 2021. PMID: 33765007 Free PMC article.
-
Linked linear mixed models: A joint analysis of fixation locations and fixation durations in natural reading.Psychon Bull Rev. 2017 Jun;24(3):637-651. doi: 10.3758/s13423-016-1138-y. Psychon Bull Rev. 2017. PMID: 27612862 Free PMC article. Review.
-
New Perspectives on Serialism and Parallelism in Oculomotor Control During Reading: The Multi-Constituent Unit Hypothesis.Vision (Basel). 2019 Sep 25;3(4):50. doi: 10.3390/vision3040050. Vision (Basel). 2019. PMID: 31735851 Free PMC article. Review.
-
Processing difficulty while reading words with neighbors is not due to increased foveal load: Evidence from eye movements.Atten Percept Psychophys. 2024 May;86(4):1360-1374. doi: 10.3758/s13414-024-02880-z. Epub 2024 Mar 26. Atten Percept Psychophys. 2024. PMID: 38532237
References
-
- Brysbaert M., Vitu F. Word skipping: Implications for theories of eye movement control in reading. In: Underwood G., editor. Eye guidance in reading and scene perception. Oxford, UK: Elsevier; 1998. pp. 125–147.
-
- Downing C. J., Pinker S. The spatial structure of visual attention. In: Posner M. I., Matin O. S., editors. Attention and performance XI: Mechanisms of attention. Hillsdale, NJ: Lawrence Erlbaum Associates, Inc; 1985. pp. 171–187.
-
- Drieghe D., Brysbaert M., Desmet T., De Baecke C. Word skipping in reading: On the interplay of linguistic and visual factors. European Journal of Cognitive Psychology. 2004;16(1–2):79–103.
-
- Engbert R., Kliegl R. Mathematical models of eye movements in reading: A possible role for autonomous saccades. Biological Cybernetics. 2001;85(2):77–87. - PubMed
LinkOut - more resources
Full Text Sources