

Streptozotocin-induced cytotoxicity, oxidative stress and mitochondrial dysfunction in human hepatoma HepG2 cells
- PMID: 22754329
- PMCID: PMC3382802
- DOI: 10.3390/ijms13055751
Streptozotocin-induced cytotoxicity, oxidative stress and mitochondrial dysfunction in human hepatoma HepG2 cells
Abstract
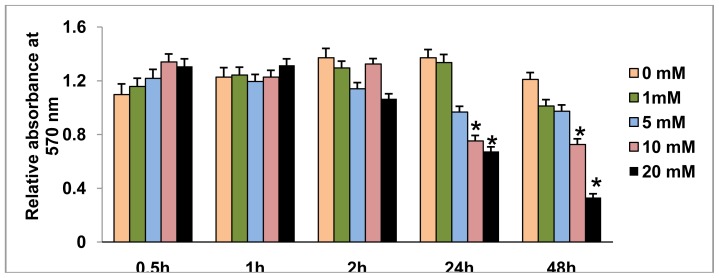
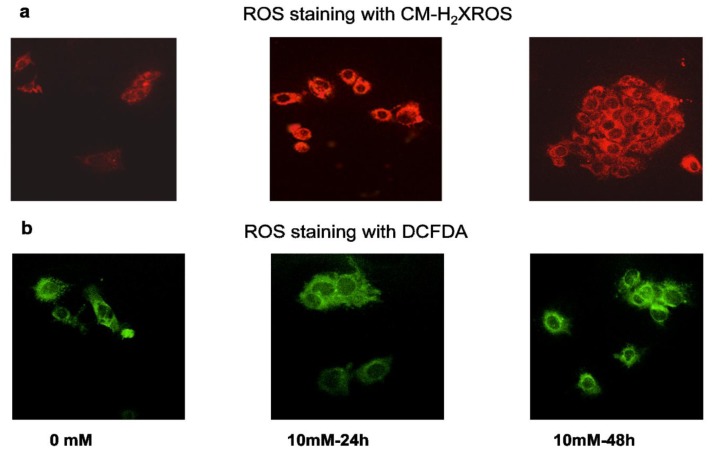
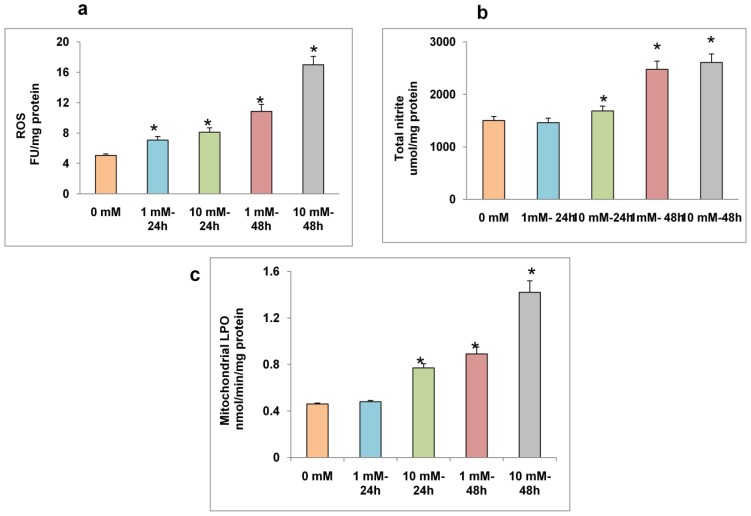
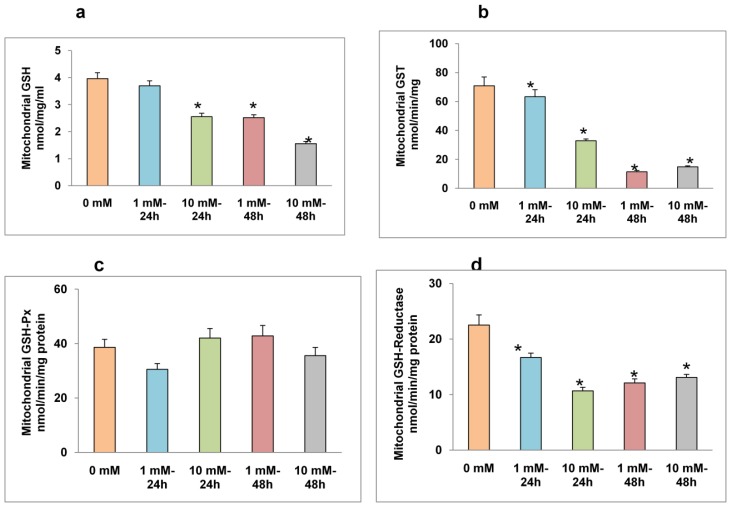
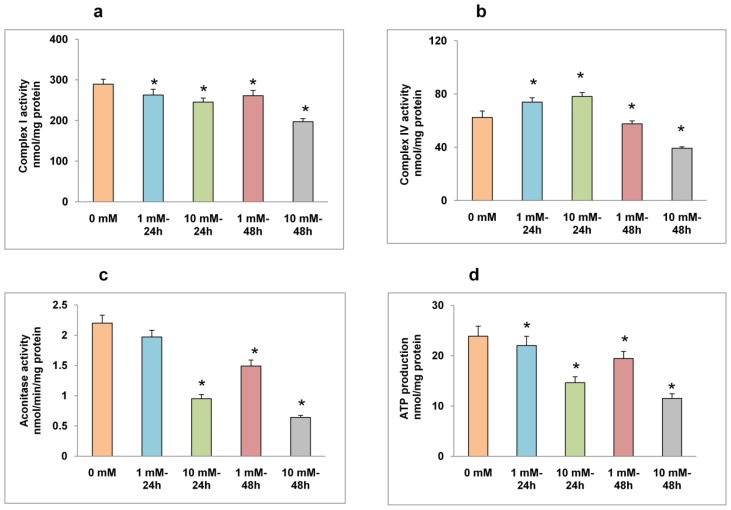
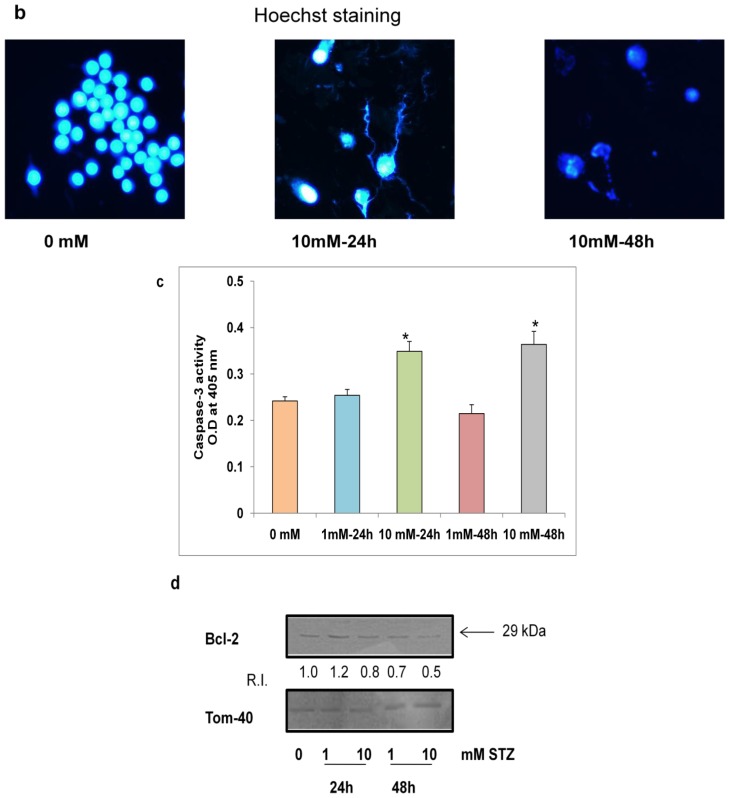
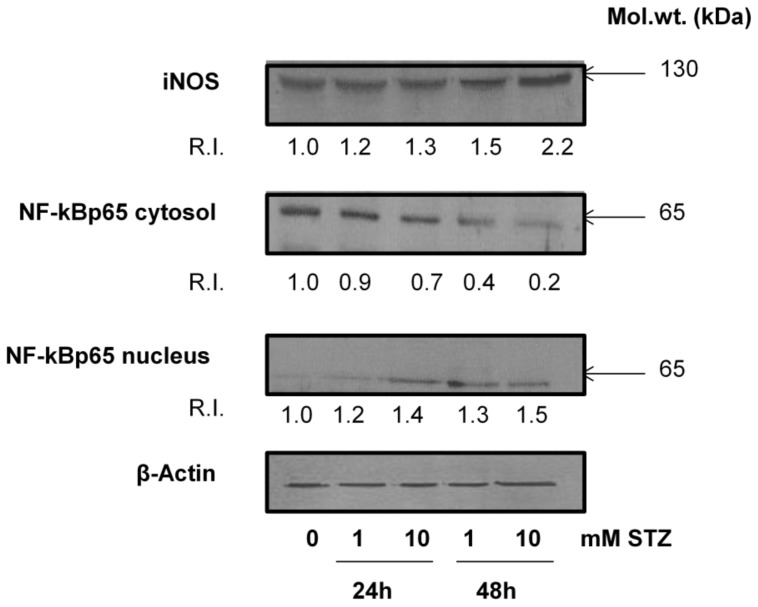
Streptozotocin (STZ) is an antibiotic often used in the treatment of different types of cancers. It is also highly cytotoxic to the pancreatic beta-cells and therefore is commonly used to induce experimental type 1 diabetes in rodents. Resistance towards STZ-induced cytotoxicity in cancer cells has also been reported. Our previous studies have reported organ-specific toxicity and metabolic alterations in STZ-induced diabetic rats. STZ induces oxidative stress and metabolic complications. The precise molecular mechanism of STZ-induced toxicity in different tissues and carcinomas is, however, unclear. We have, therefore, investigated the mechanism of cytotoxicity of STZ in HepG2 hepatoma cells in culture. Cells were treated with different doses of STZ for various time intervals and the cytotoxicity was studied by observing the alterations in oxidative stress, mitochondrial redox and metabolic functions. STZ induced ROS and RNS formation and oxidative stress as measured by an increase in the lipid peroxidation as well as alterations in the GSH-dependent antioxidant metabolism. The mitochondria appear to be a highly sensitive target for STZ toxicity. The mitochondrial membrane potential and enzyme activities were altered in STZ treated cells resulting in the inhibition of ATP synthesis. ROS-sensitive mitochondrial aconitase activity was markedly inhibited suggesting increased oxidative stress in STZ-induced mitochondrial toxicity. These results suggest that STZ-induced cytotoxicity in HepG2 cells is mediated, at least in part, by the increase in ROS/RNS production, oxidative stress and mitochondrial dysfunction. Our study may be significant for better understanding the mechanisms of STZ action in chemotherapy and drug induced toxicity.
Keywords: GSH; HepG2 cells; ROS; mitochondria; oxidative stress; streptozotocin.
Figures

Similar articles
-
Elucidation of Molecular Mechanisms of Streptozotocin-Induced Oxidative Stress, Apoptosis, and Mitochondrial Dysfunction in Rin-5F Pancreatic β-Cells.Oxid Med Cell Longev. 2017;2017:7054272. doi: 10.1155/2017/7054272. Epub 2017 Aug 6. Oxid Med Cell Longev. 2017. PMID: 28845214 Free PMC article.
-
Cytoprotective Effects of N-Acetylcysteine on Streptozotocin- Induced Oxidative Stress and Apoptosis in RIN-5F Pancreatic β-Cells.Cell Physiol Biochem. 2018;51(1):201-216. doi: 10.1159/000495200. Epub 2018 Nov 16. Cell Physiol Biochem. 2018. PMID: 30448838
-
Implications of altered glutathione metabolism in aspirin-induced oxidative stress and mitochondrial dysfunction in HepG2 cells.PLoS One. 2012;7(4):e36325. doi: 10.1371/journal.pone.0036325. Epub 2012 Apr 30. PLoS One. 2012. PMID: 22558435 Free PMC article.
-
Recent progress in adverse events of carboxylic acid non-steroidal anti-inflammatory drugs (CBA-NSAIDs) and their association with the metabolism: the consequences on mitochondrial dysfunction and oxidative stress, and prevention with natural plant extracts.Expert Opin Drug Metab Toxicol. 2024 Aug;20(8):765-785. doi: 10.1080/17425255.2024.2378885. Epub 2024 Jul 12. Expert Opin Drug Metab Toxicol. 2024. PMID: 38980754 Review.
-
Streptozotocin-induced type 1 diabetes in rodents as a model for studying mitochondrial mechanisms of diabetic β cell glucotoxicity.Diabetes Metab Syndr Obes. 2015 Apr 2;8:181-8. doi: 10.2147/DMSO.S82272. eCollection 2015. Diabetes Metab Syndr Obes. 2015. PMID: 25897251 Free PMC article. Review.
Cited by
-
Elucidation of Molecular Mechanisms of Streptozotocin-Induced Oxidative Stress, Apoptosis, and Mitochondrial Dysfunction in Rin-5F Pancreatic β-Cells.Oxid Med Cell Longev. 2017;2017:7054272. doi: 10.1155/2017/7054272. Epub 2017 Aug 6. Oxid Med Cell Longev. 2017. PMID: 28845214 Free PMC article.
-
Modulation of the Nitrergic Pathway via Activation of PPAR-γ Contributes to the Neuroprotective Effect of Pioglitazone Against Streptozotocin-Induced Memory Dysfunction.J Mol Neurosci. 2015 Jul;56(3):739-50. doi: 10.1007/s12031-015-0508-7. Epub 2015 Feb 18. J Mol Neurosci. 2015. PMID: 25854775
-
Quercus infectoria Gall Ethanolic Extract Accelerates Wound Healing through Attenuating Inflammation and Oxidative Injuries in Skin Fibroblasts.Antioxidants (Basel). 2024 Sep 9;13(9):1094. doi: 10.3390/antiox13091094. Antioxidants (Basel). 2024. PMID: 39334753 Free PMC article.
-
Maslinic Acid Protects against Streptozotocin-Induced Diabetic Retinopathy by Activating Nrf2 and Suppressing NF-κB.J Ophthalmol. 2022 Feb 28;2022:3044202. doi: 10.1155/2022/3044202. eCollection 2022. J Ophthalmol. 2022. PMID: 35265366 Free PMC article.
-
Insights into the phytochemical profiling, antidiabetic and antioxidant potentials of Lepionurus sylvestris Blume extract in fructose/streptozotocin-induced diabetic rats.Front Pharmacol. 2024 Jul 12;15:1424346. doi: 10.3389/fphar.2024.1424346. eCollection 2024. Front Pharmacol. 2024. PMID: 39070783 Free PMC article.
References
-
- Weiss R.B. Streptozotocin: A review of its pharmacology, efficacy, and toxicity. Cancer Treat. Rep. 1982;66:427–438. - PubMed
-
- Dolan M.E. Inhibition of DNA repair as a means of increasing the antitumor activity of DNA active agents. Adv. Drug Del. Rev. 1997;26:105–118. - PubMed
-
- Lewis C., Barbiers A.R. Streptozotocin, a new antibiotic. In vitro and in vivo evaluation. Antibiot. Ann. 1959;7:247–254. - PubMed
-
- Schroy P.C., III, Cohen A., Winawer S.J., Friedman E.A. New chemotherapeutic drug sensitivity assay for colon carcinomas in monolayer culture. Cancer Res. 1988;48:3236–3244. - PubMed
-
- Van Dyke K., Jabbour N., Hoeldtke R., van dyke C., van dyke M. Oxidative/nitrosative stresses trigger type I diabetes: Preventable in streptozotocin rats and detectable in human disease. Ann. N. Y. Acad. Sci. 2010;1203:138–145. - PubMed
Publication types
MeSH terms
Substances
LinkOut - more resources
Full Text Sources
