Mechanisms and benefits of granule cell latency coding in the mouse olfactory bulb
- PMID: 22754503
- PMCID: PMC3385563
- DOI: 10.3389/fncir.2012.00040
Mechanisms and benefits of granule cell latency coding in the mouse olfactory bulb
Abstract
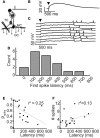
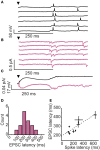
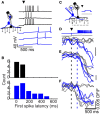
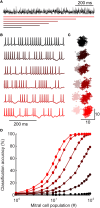
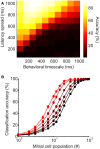
Inhibitory circuits are critical for shaping odor representations in the olfactory bulb. There, individual granule cells can respond to brief stimulation with extremely long (up to 1000 ms), input-specific latencies that are highly reliable. However, the mechanism and function of this long timescale activity remain unknown. We sought to elucidate the mechanism responsible for long-latency activity, and to understand the impact of widely distributed interneuron latencies on olfactory coding. We used a combination of electrophysiological, optical, and pharmacological techniques to show that long-latency inhibition is driven by late onset synaptic excitation to granule cells. This late excitation originates from tufted cells, which have intrinsic properties that favor longer latency spiking than mitral cells. Using computational modeling, we show that widely distributed interneuron latency increases the discriminability of similar stimuli. Thus, long-latency inhibition in the olfactory bulb requires a combination of circuit- and cellular-level mechanisms that function to improve stimulus representations.
Keywords: coding; inhibition; latency; olfactory bulb.
Figures

Similar articles
-
Differences in Glomerular-Layer-Mediated Feedforward Inhibition onto Mitral and Tufted Cells Lead to Distinct Modes of Intensity Coding.J Neurosci. 2017 Feb 8;37(6):1428-1438. doi: 10.1523/JNEUROSCI.2245-16.2016. Epub 2016 Dec 27. J Neurosci. 2017. PMID: 28028200 Free PMC article.
-
Direct Recording of Dendrodendritic Excitation in the Olfactory Bulb: Divergent Properties of Local and External Glutamatergic Inputs Govern Synaptic Integration in Granule Cells.J Neurosci. 2017 Dec 6;37(49):11774-11788. doi: 10.1523/JNEUROSCI.2033-17.2017. Epub 2017 Oct 24. J Neurosci. 2017. PMID: 29066560 Free PMC article.
-
Improved Separation of Odor Responses in Granule Cells of the Olfactory Bulb During Odor Discrimination Learning.Front Cell Neurosci. 2020 Oct 9;14:579349. doi: 10.3389/fncel.2020.579349. eCollection 2020. Front Cell Neurosci. 2020. PMID: 33192325 Free PMC article.
-
Functional Specialization of Interneuron Dendrites: Identification of Action Potential Initiation Zone in Axonless Olfactory Bulb Granule Cells.J Neurosci. 2019 Dec 4;39(49):9674-9688. doi: 10.1523/JNEUROSCI.1763-19.2019. Epub 2019 Oct 29. J Neurosci. 2019. PMID: 31662426 Free PMC article.
-
Inhibitory circuits of the mammalian main olfactory bulb.J Neurophysiol. 2017 Oct 1;118(4):2034-2051. doi: 10.1152/jn.00109.2017. Epub 2017 Jul 19. J Neurophysiol. 2017. PMID: 28724776 Free PMC article. Review.
Cited by
-
Greater excitability and firing irregularity of tufted cells underlies distinct afferent-evoked activity of olfactory bulb mitral and tufted cells.J Physiol. 2014 May 15;592(10):2097-118. doi: 10.1113/jphysiol.2013.269886. Epub 2014 Mar 10. J Physiol. 2014. PMID: 24614745 Free PMC article.
-
Local Postsynaptic Signaling on Slow Time Scales in Reciprocal Olfactory Bulb Granule Cell Spines Matches Asynchronous Release.Front Synaptic Neurosci. 2020 Nov 16;12:551691. doi: 10.3389/fnsyn.2020.551691. eCollection 2020. Front Synaptic Neurosci. 2020. PMID: 33304264 Free PMC article.
-
Principal cell activity induces spine relocation of adult-born interneurons in the olfactory bulb.Nat Commun. 2016 Aug 31;7:12659. doi: 10.1038/ncomms12659. Nat Commun. 2016. PMID: 27578235 Free PMC article.
-
Anatomical and Functional Connectivity at the Dendrodendritic Reciprocal Mitral Cell-Granule Cell Synapse: Impact on Recurrent and Lateral Inhibition.Front Neural Circuits. 2022 Jul 22;16:933201. doi: 10.3389/fncir.2022.933201. eCollection 2022. Front Neural Circuits. 2022. PMID: 35937203 Free PMC article.
-
Glucose sensitivity of mouse olfactory bulb neurons is conveyed by a voltage-gated potassium channel.J Physiol. 2013 May 15;591(10):2541-61. doi: 10.1113/jphysiol.2013.254086. Epub 2013 Mar 11. J Physiol. 2013. PMID: 23478133 Free PMC article.
References
-
- Abraham N. M., Egger V., Shimshek D. R., Renden R., Fukunaga I., Sprengel R., Seeburg P. H., Klugmann M., Margrie T. W., Schaefer A. T., Kuner T. (2010). Synaptic inhibition in the olfactory bulb accelerates odor discrimination in mice. Neuron 65, 399–411 10.1016/j.neuron.2010.01.009 - DOI - PMC - PubMed
Grants and funding
LinkOut - more resources
Full Text Sources

