. 2012 Jun 27:6:50.
doi: 10.3389/fnsys.2012.00050. eCollection 2012.

Music-induced cortical plasticity and lateral inhibition in the human auditory cortex as foundations for tonal tinnitus treatment

Affiliations

Music-induced cortical plasticity and lateral inhibition in the human auditory cortex as foundations for tonal tinnitus treatment

Christo Pantev et al. Front Syst Neurosci. .

Abstract

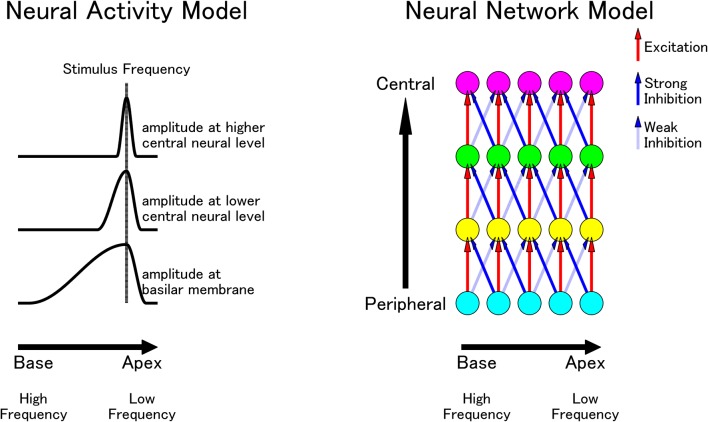
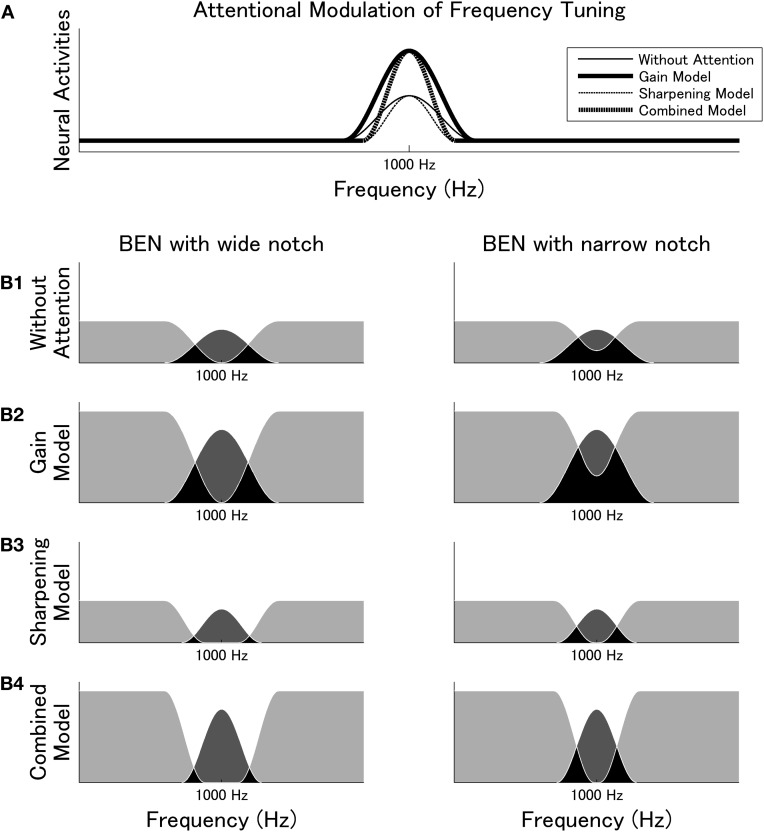
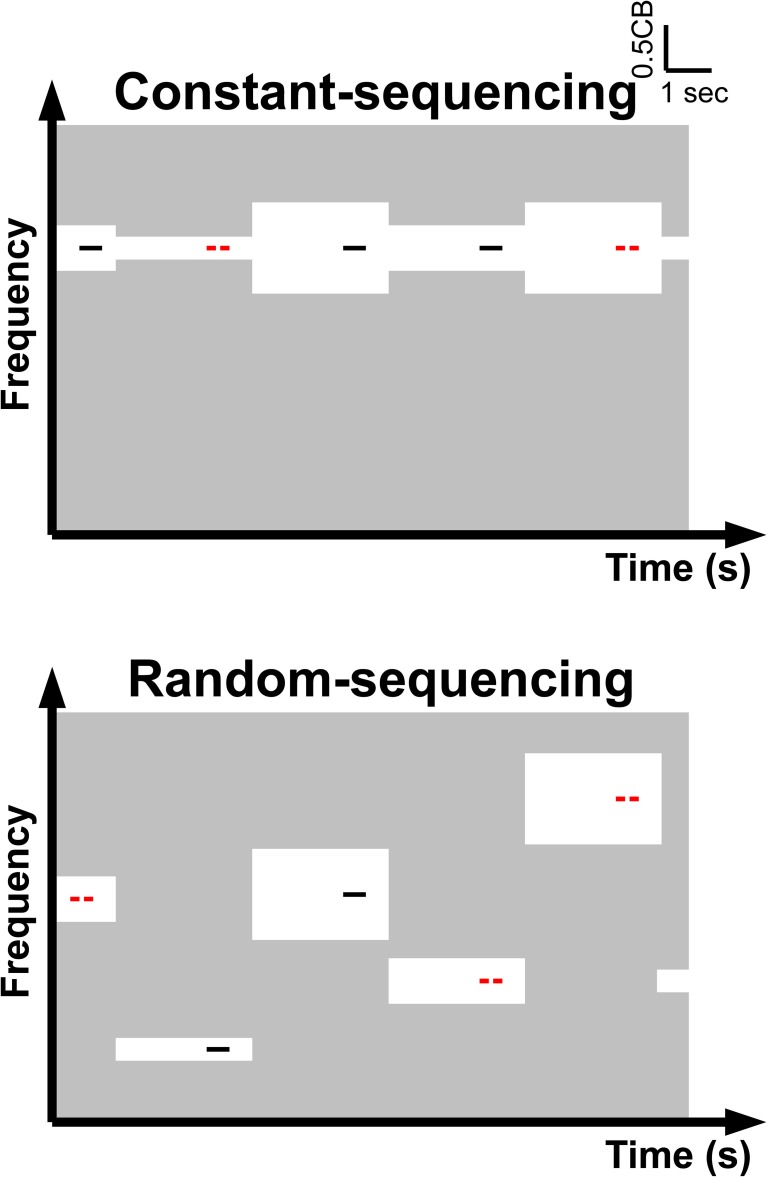
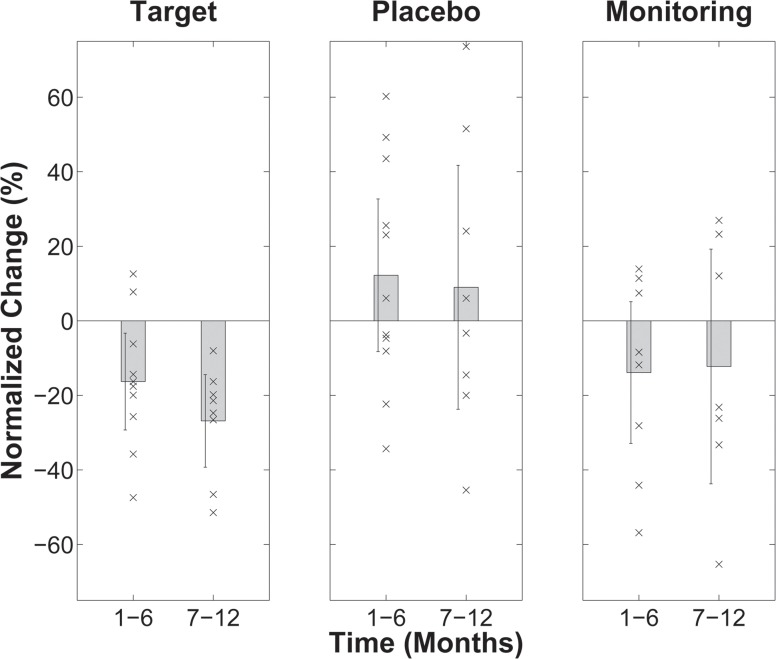
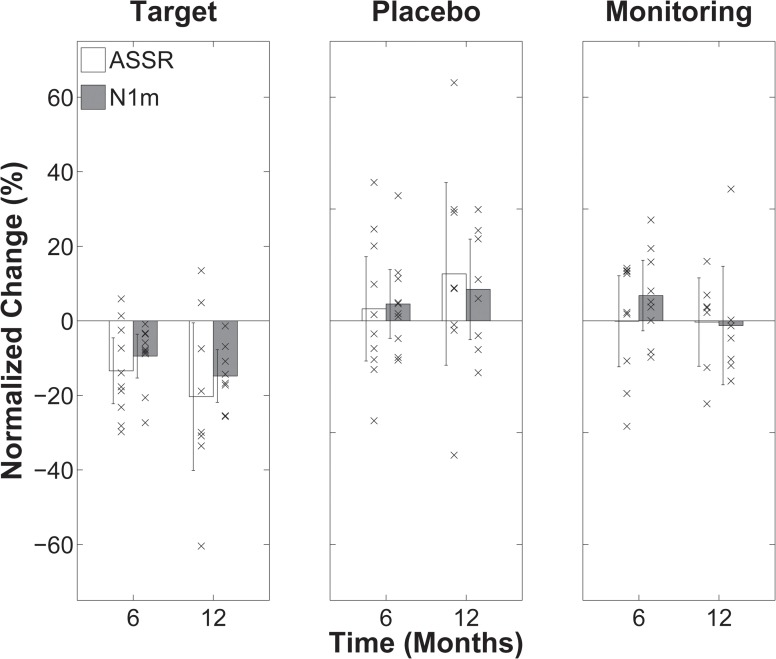
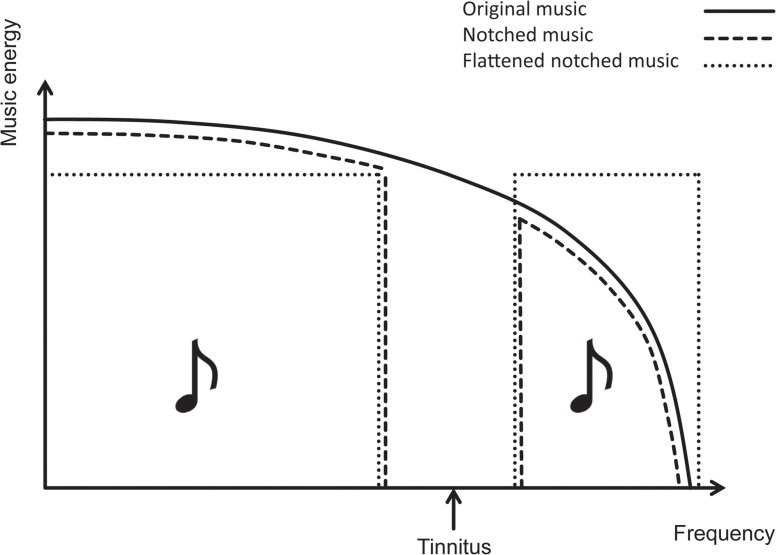
Over the past 15 years, we have studied plasticity in the human auditory cortex by means of magnetoencephalography (MEG). Two main topics nurtured our curiosity: the effects of musical training on plasticity in the auditory system, and the effects of lateral inhibition. One of our plasticity studies found that listening to notched music for 3 h inhibited the neuronal activity in the auditory cortex that corresponded to the center-frequency of the notch, suggesting suppression of neural activity by lateral inhibition. Subsequent research on this topic found that suppression was notably dependent upon the notch width employed, that the lower notch-edge induced stronger attenuation of neural activity than the higher notch-edge, and that auditory focused attention strengthened the inhibitory networks. Crucially, the overall effects of lateral inhibition on human auditory cortical activity were stronger than the habituation effects. Based on these results we developed a novel treatment strategy for tonal tinnitus-tailor-made notched music training (TMNMT). By notching the music energy spectrum around the individual tinnitus frequency, we intended to attract lateral inhibition to auditory neurons involved in tinnitus perception. So far, the training strategy has been evaluated in two studies. The results of the initial long-term controlled study (12 months) supported the validity of the treatment concept: subjective tinnitus loudness and annoyance were significantly reduced after TMNMT but not when notching spared the tinnitus frequencies. Correspondingly, tinnitus-related auditory evoked fields (AEFs) were significantly reduced after training. The subsequent short-term (5 days) training study indicated that training was more effective in the case of tinnitus frequencies ≤ 8 kHz compared to tinnitus frequencies >8 kHz, and that training should be employed over a long-term in order to induce more persistent effects. Further development and evaluation of TMNMT therapy are planned. A goal is to transfer this novel, completely non-invasive and low-cost treatment approach for tonal tinnitus into routine clinical practice.

Keywords: human auditory cortex; lateral inhibition; music-induced cortical plasticity; tailor-made notched music training; tonal tinnitus treatment.


Figures

Figure 1
Figure 1
(From Zatorre et al., ) The figure illustrates the feedback and the feedforward interactions that occur during music performance. As a musician plays an instrument, motor systems control the fine movements needed to produce sound. The sound is processed by auditory circuitry, which, in turn, is used to adjust motor output to achieve the desired effect. Output signals from premotor cortices are also thought to influence responses within the auditory cortex, even in the absence of sound, or prior to sound; conversely, motor representations are thought to be active on hearing sound, even in the absence of movement. There is, therefore, a tight linkage between sensory and production mechanisms.
Figure 2
Figure 2
(From Lappe et al., ). (A) Tone sequences for the standard and deviant stimuli that were used in the MEG measurements before and after training. (B) Musical score of the I–IV–V–I chord progression in c-major in broken chords that was used as a training sequence for SA and A training. (C) Visual templates for the SA training for each broken chord of the training sequence. Numbers represent the fingers (thumb, 1; index finger, 2; etc.) with which the subjects were supposed to press the corresponding piano keys. On each template, the image of the piano keyboard was depicted and the finger placement was marked. For each chord, the notes were to be played in ascending order first, and then descending again (compare score in B).
Figure 3
Figure 3
(Modified from Lappe et al., ) Group averages of the source waveforms which were obtained after performing source space projection before and after training for both groups (SA = Sensorimotor-Auditory; A = Auditory), stimulus conditions, and hemispheres. Data for the three-tone sequences are shown in the top four panels and data for the six-tone sequences in the bottom four panels. Within each set of four panels, SA group data are shown in the top row, and A group data are shown in the bottom row. Data from the left hemisphere (LH) are presented on the left and those of the right hemisphere (RH) on the right. Thin lines indicate pre-training (pre) data and thick lines post-training (post) data.
Figure 4
Figure 4
(Modified from Pantev et al. () Amplitude spectra of the comb filtered noise (CFN), the pass-band stimulus (PB), and the eliminated-band stimulus (EB) (rows a, b, and c, respectively). The frequency components of the PB-stimulus correspond to pass-band sections of the CFN, whereas those of the EB-stimulus correspond to eliminated-band sections of the CFN.
Figure 5
Figure 5
(Modified from Okamoto et al., ,) A hypothesized neural network in the human auditory system. Left: a schematic diagram of hypothesized neural activity corresponding to a stimulus frequency from the peripheral to the central auditory pathway. Neural activity becomes sharper at more central levels, especially in the high-frequency range. Right: a hypothetical excitatory and inhibitory neural network from the peripheral to the central auditory pathway. Red lines indicate excitatory neural connections and blue lines indicate inhibitory connections. Solid blue lines projecting from lower to higher frequencies have stronger inhibitory effects than the dashed blue lines projecting from higher to lower frequencies.
Figure 6
Figure 6
(Modified from Okamoto et al., ,) Attentional modulation of frequency tuning. (A) Different effects of attention (gain, sharpening, and combined (gain plus sharpening) models) modulate the population-level neural activities corresponding to the 1000 Hz test stimulus. (B1–B4) The relationship between neural activities elicited by BEN and TS as predicted by the different attention models. Light gray areas represent neural activities exclusively elicited by BEN and dark gray areas represent neural activities exclusively elicited by TS. Black areas indicate overlap: neurons in these areas had already been activated by BEN when TS appeared. Dark gray areas represent N1m source strength reflecting TS onset. B1 displays neural activities evoked without focused auditory attention. B2, B3, and B4 illustrate the gain model, the sharpening model, and the combined (gain plus sharpening) model, respectively. Diagrams on the left illustrate BENs with broad spectral notches; diagrams on the right illustrate BENs with narrow spectral notches. It is notable that the size ratios of the dark gray areas between the narrow BEN and the wide BEN differ between models: B3 and B4 have ratios much closer to one than B1 and B2, reflecting the sharpening effect of attention on population-level frequency tuning.
Figure 7
Figure 7
(Modified from Okamoto et al., ) Concept and time course of auditory stimulation in the constant sequencing and random sequencing conditions. Pass-bands and stop-bands of the band-eliminated noises (BENs) are represented by the light gray and white areas, respectively. The notch-bandwidth of a BEN (white area) is either 1/4, 1/2, or 1 critical band. Target and non-target test stimuli (TS) are represented as red lines with gap (target TS, requiring a button press) and black lines without gap (non-target TS), respectively. During the constant sequencing condition (upper graph), the TS is a series of identical frequencies, whereas during the random sequencing condition (lower graph) the TS has different frequencies. The TS frequencies differed between constant sequencing blocks. In total, identical bottom-up auditory inputs are provided during the constant sequencing and random sequencing conditions.
Figure 8
Figure 8
(Modified from Okamoto et al., ,) Normalized tinnitus loudness change after 6 and 12 months of treatment (or monitoring) relative to baseline (=0) for the three patient groups (target TMNMT, placebo TMNMT, and monitoring). Positive change values reflect impairment; negative change values reflect improvement. The bars indicate group averages and each “×” indicates an individual data point. The error bars denote confidence intervals. As indicated by the confidence interval bars, only the changes in the target group were statistically significant.
Figure 9
Figure 9
(Modified from Okamoto et al., ,) Change in normalized tinnitus-related auditory cortical evoked activity after 6 and 12 months of treatment (or monitoring) relative to baseline (=0) for the three patient groups (target TMNMT, placebo TMNMT, and monitoring). Positive change values reflect increase in activity; negative change values reflect decrease in activity. The bars indicate group averages and each “×” indicates an individual data point. The error bars denote confidence intervals. Auditory steady state response (ASSR) change values are reflected by white bars and N1m change values are reflected by gray bars. As indicated by the confidence interval bars, only the changes in the target group were statistically significant.
Figure 10
Figure 10
Schematic illustration of the energy spectra of original (i.e., unmodified) music (black line), notched music (green line), and flattened notched music (blue line). The red arrow indicates the tinnitus frequency, at which the notches are centered.

Similar articles

Cited by

References

    1. Bangert M., Schlaug G. (2006). Specialization of the specialized in features of external human brain morphology. Eur. J. Neurosci. 24, 1832–1834. 10.1111/j.1460-9568.2006.05031.x - DOI - PubMed
    1. Bauer C. A., Turner J. G., Caspary D. M., Myers K. S., Brozoski T. J. (2008). Tinnitus and inferior colliculus activity in chinchillas related to three distinct patterns of cochlear trauma. J. Neurosci. Res. 86, 2564–2578. 10.1002/jnr.21699 - DOI - PMC - PubMed
    1. Bermudez P., Lerch J. P., Evans A. C., Zatorre R. J. (2009). Neuroanatomical correlates of musicianship as revealed by cortical thickness and voxel-based morphometry. Cereb. Cortex 19, 1583–1596. 10.1093/cercor/bhn196 - DOI - PubMed
    1. Besson M., Schon D., Moreno S., Santos A., Magne C. (2007). Influence of musical expertise and musical training on pitch processing in music and language. Restor. Neurol. Neurosci. 25, 399–410. - PubMed
    1. Burrows D. L., Barry S. J. (1990). Electrophysiological evidence for the critical band in humans: middle-latency responses. J. Acoust. Soc. Am. 88, 180–184. 10.1121/1.399938 - DOI - PubMed