

Non-stationary discharge patterns in motor cortex under subthalamic nucleus deep brain stimulation
- PMID: 22754509
- PMCID: PMC3385519
- DOI: 10.3389/fnint.2012.00035
Non-stationary discharge patterns in motor cortex under subthalamic nucleus deep brain stimulation
Abstract
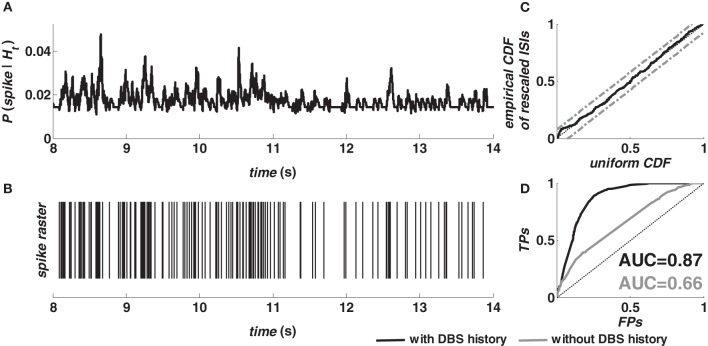
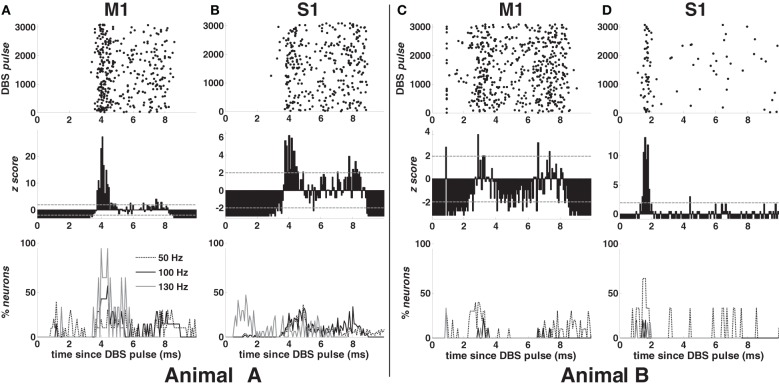
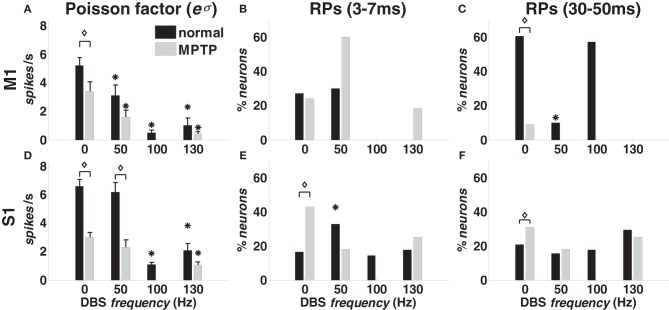
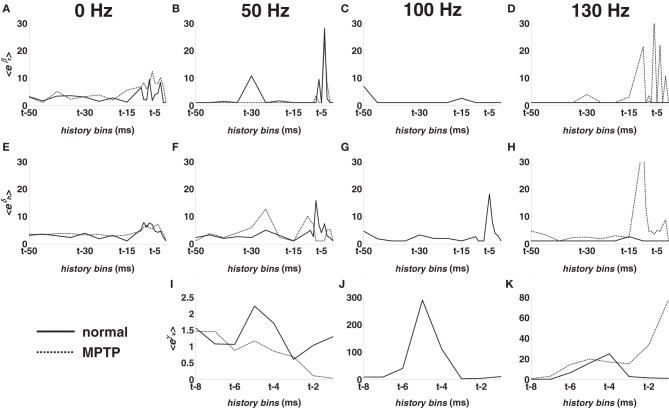
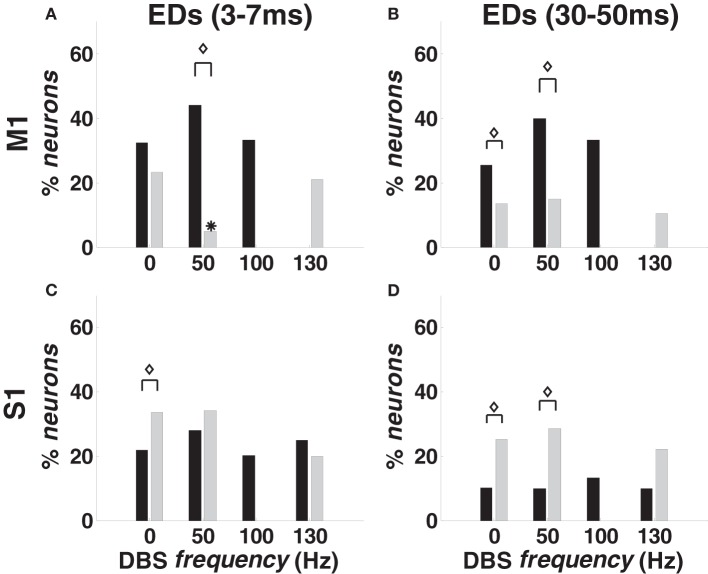
Deep brain stimulation (DBS) of the subthalamic nucleus (STN) directly modulates the basal ganglia (BG), but how such stimulation impacts the cortex upstream is largely unknown. There is evidence of cortical activation in 6-hydroxydopamine (OHDA)-lesioned rodents and facilitation of motor evoked potentials in Parkinson's disease (PD) patients, but the impact of the DBS settings on the cortical activity in normal vs. Parkinsonian conditions is still debated. We use point process models to analyze non-stationary activation patterns and inter-neuronal dependencies in the motor and sensory cortices of two non-human primates during STN DBS. These features are enhanced after treatment with 1-methyl-4-phenyl-1,2,3,6-tetrahydropyridine (MPTP), which causes a consistent PD-like motor impairment, while high-frequency (HF) DBS (i.e., ≥100 Hz) strongly reduces the short-term patterns (period: 3-7 ms) both before and after MPTP treatment, and elicits a short-latency post-stimulus activation. Low-frequency DBS (i.e., ≤50 Hz), instead, has negligible effects on the non-stationary features. Finally, by using tools from the information theory [i.e., receiver operating characteristic (ROC) curve and information rate (IR)], we show that the predictive power of these models is dependent on the DBS settings, i.e., the probability of spiking of the cortical neurons (which is captured by the point process models) is significantly conditioned on the timely delivery of the DBS input. This dependency increases with the DBS frequency and is significantly larger for high- vs. low-frequency DBS. Overall, the selective suppression of non-stationary features and the increased modulation of the spike probability suggest that HF STN DBS enhances the neuronal activation in motor and sensory cortices, presumably because of reinforcement mechanisms, which perhaps involve the overlap between feedback antidromic and feed-forward orthodromic responses along the BG-thalamo-cortical loop.
Keywords: Parkinson's disease; deep brain stimulation; information rate; motor cortex; point processes; receiver operating characteristic curve; spike trains.
Figures
Similar articles
-
Model-based deconstruction of cortical evoked potentials generated by subthalamic nucleus deep brain stimulation.J Neurophysiol. 2018 Aug 1;120(2):662-680. doi: 10.1152/jn.00862.2017. Epub 2018 Apr 25. J Neurophysiol. 2018. PMID: 29694280 Free PMC article.
-
Reinforcement mechanisms in putamen during high frequency STN DBS: A point process study.Annu Int Conf IEEE Eng Med Biol Soc. 2012;2012:1214-7. doi: 10.1109/EMBC.2012.6346155. Annu Int Conf IEEE Eng Med Biol Soc. 2012. PMID: 23366116 Free PMC article.
-
A Point Process Model-based Framework Reveals Reinforcement Mechanisms in Striatum during High Frequency STN DBS.Proc IEEE Conf Decis Control. 2012 Dec;2012:1645-1650. doi: 10.1109/cdc.2012.6426098. Epub 2013 Feb 4. Proc IEEE Conf Decis Control. 2012. PMID: 32454557 Free PMC article.
-
Deep brain stimulation in Parkinson's disease patients and routine 6-OHDA rodent models: Synergies and pitfalls.Eur J Neurosci. 2021 Apr;53(7):2322-2343. doi: 10.1111/ejn.14950. Epub 2020 Oct 23. Eur J Neurosci. 2021. PMID: 32853415 Review.
-
Mechanisms of action underlying the efficacy of deep brain stimulation of the subthalamic nucleus in Parkinson's disease: central role of disease severity.Eur J Neurosci. 2019 Mar;49(6):805-816. doi: 10.1111/ejn.14088. Epub 2018 Aug 12. Eur J Neurosci. 2019. PMID: 30044030 Review.
Cited by
-
Long-Latency Somatosensory Evoked Potentials of the Subthalamic Nucleus in Patients with Parkinson's Disease.PLoS One. 2017 Jan 12;12(1):e0168151. doi: 10.1371/journal.pone.0168151. eCollection 2017. PLoS One. 2017. PMID: 28081139 Free PMC article. Clinical Trial.
-
Effects of antidromic and orthodromic activation of STN afferent axons during DBS in Parkinson's disease: a simulation study.Front Comput Neurosci. 2014 Mar 19;8:32. doi: 10.3389/fncom.2014.00032. eCollection 2014. Front Comput Neurosci. 2014. PMID: 24678296 Free PMC article.
-
Modulations in Oscillatory Activity of Globus Pallidus Internus Neurons During a Directed Hand Movement Task-A Primary Mechanism for Motor Planning.Front Syst Neurosci. 2019 Apr 30;13:15. doi: 10.3389/fnsys.2019.00015. eCollection 2019. Front Syst Neurosci. 2019. PMID: 31133824 Free PMC article.
-
Systems approaches to optimizing deep brain stimulation therapies in Parkinson's disease.Wiley Interdiscip Rev Syst Biol Med. 2018 Sep;10(5):e1421. doi: 10.1002/wsbm.1421. Epub 2018 Mar 20. Wiley Interdiscip Rev Syst Biol Med. 2018. PMID: 29558564 Free PMC article. Review.
-
Optimizing the learning rate for adaptive estimation of neural encoding models.PLoS Comput Biol. 2018 May 29;14(5):e1006168. doi: 10.1371/journal.pcbi.1006168. eCollection 2018 May. PLoS Comput Biol. 2018. PMID: 29813069 Free PMC article.
References
-
- Akaike H. (1974). A new look at the statistical model identification. IEEE Trans. Aut. Control 19, 716–723
-
- Baker K., Boulis N. B., Rezai A. R., Montgomery E. B. (2004). “Target selection using microelectrode recording,” in Microelectrode Recordings in Movement Disorder Surgery, ed Thieme (New York, NY: Thieme; ), 138–151
-
- Bamber D. (1975). The area above the ordinal dominance graph and the area below the receiver operating characteristic graph. J. Math. Psychol. 12, 387–415
Grants and funding
LinkOut - more resources
Full Text Sources
Research Materials
Miscellaneous