. 2012 Jun 29:6:42.
doi: 10.3389/fncom.2012.00042. eCollection 2012.

Persistence and storage of activity patterns in spiking recurrent cortical networks: modulation of sigmoid signals by after-hyperpolarization currents and acetylcholine

Affiliations

Persistence and storage of activity patterns in spiking recurrent cortical networks: modulation of sigmoid signals by after-hyperpolarization currents and acetylcholine

Jesse Palma et al. Front Comput Neurosci. .

Abstract

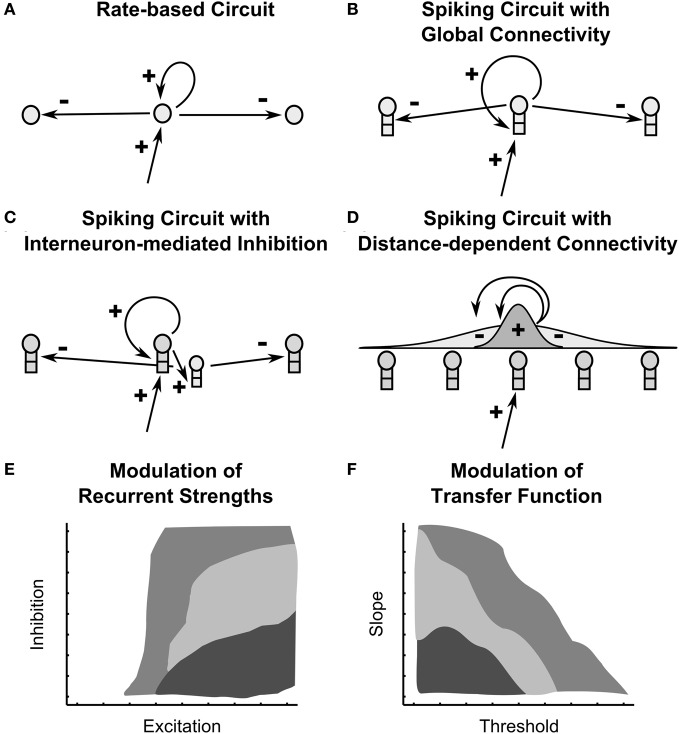
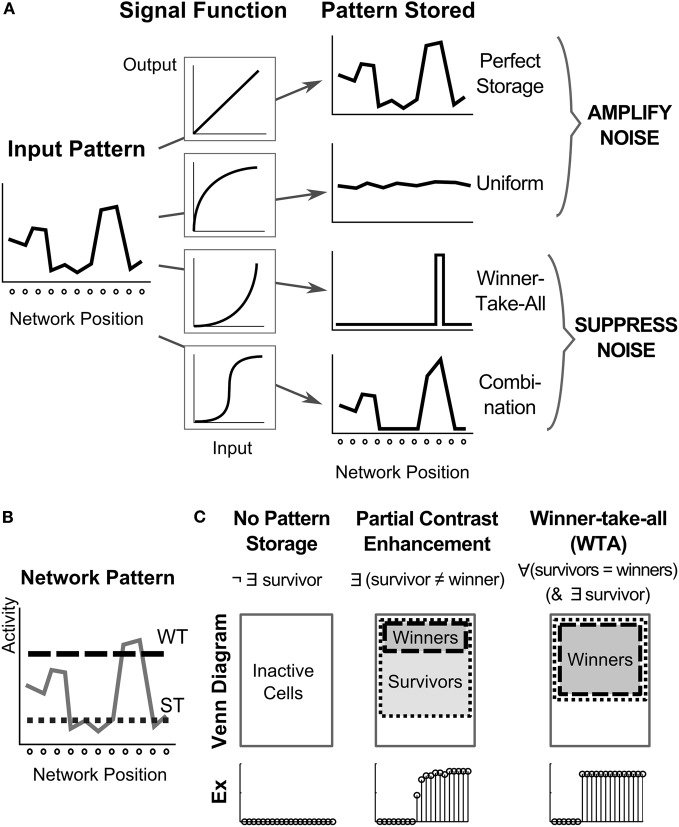
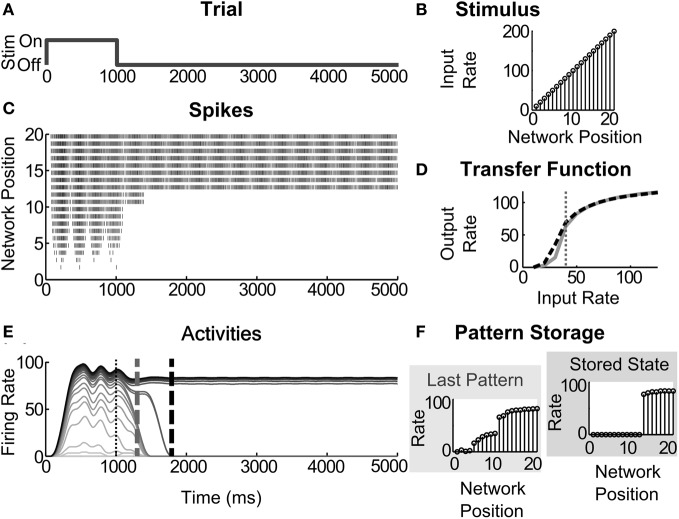
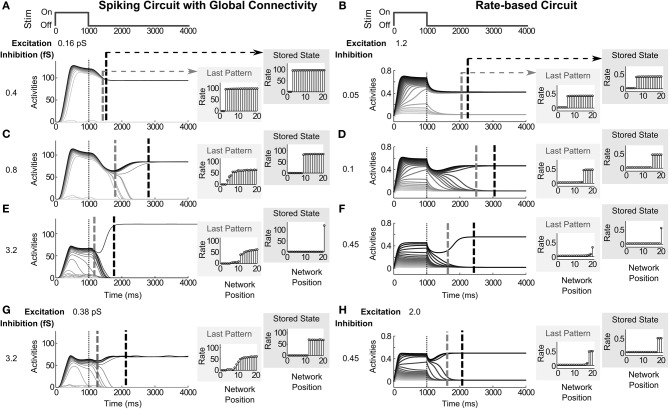
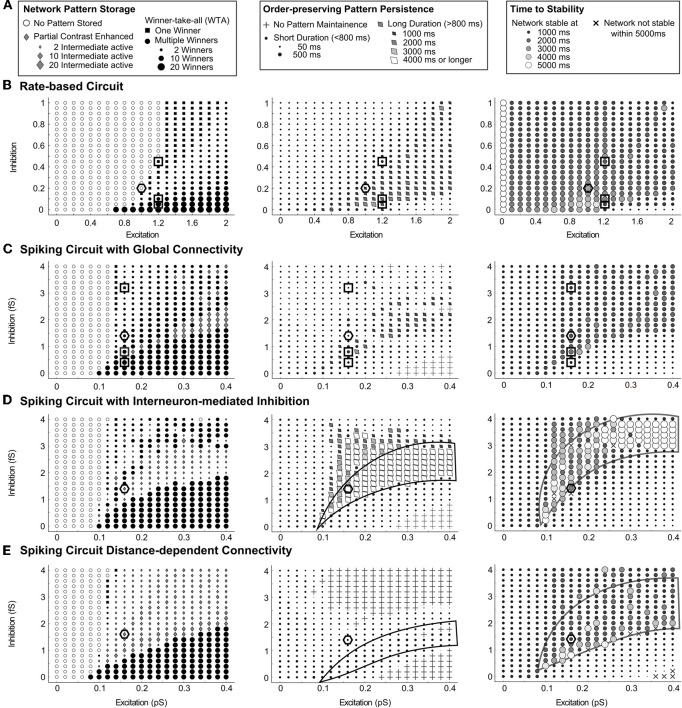
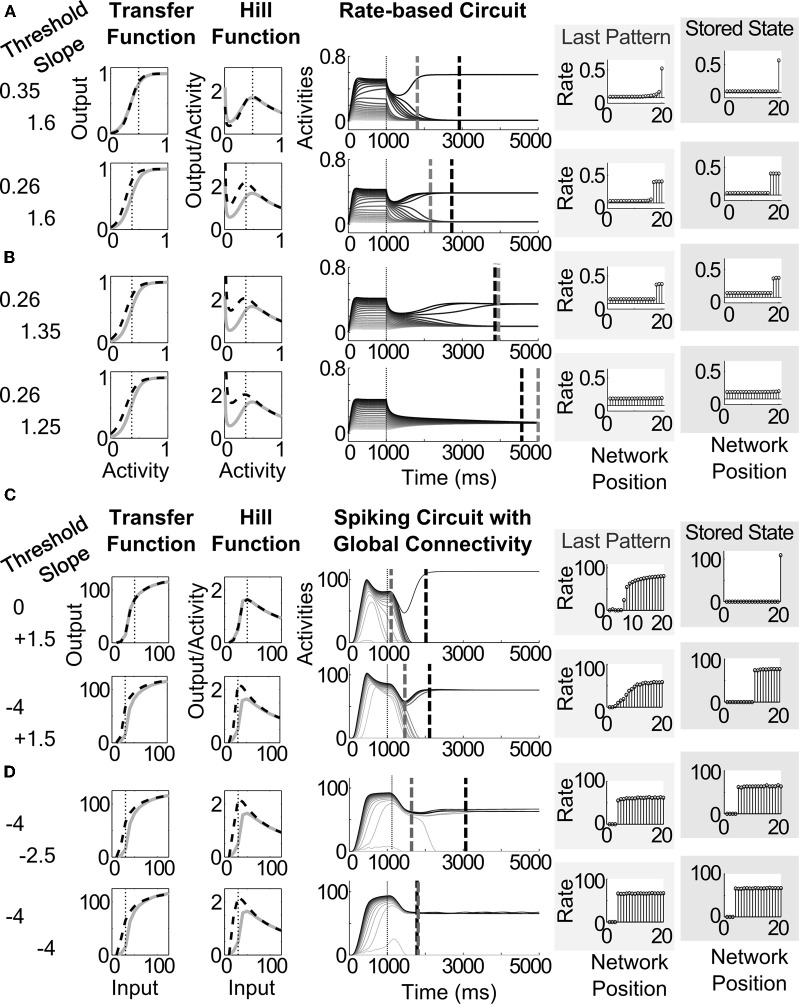
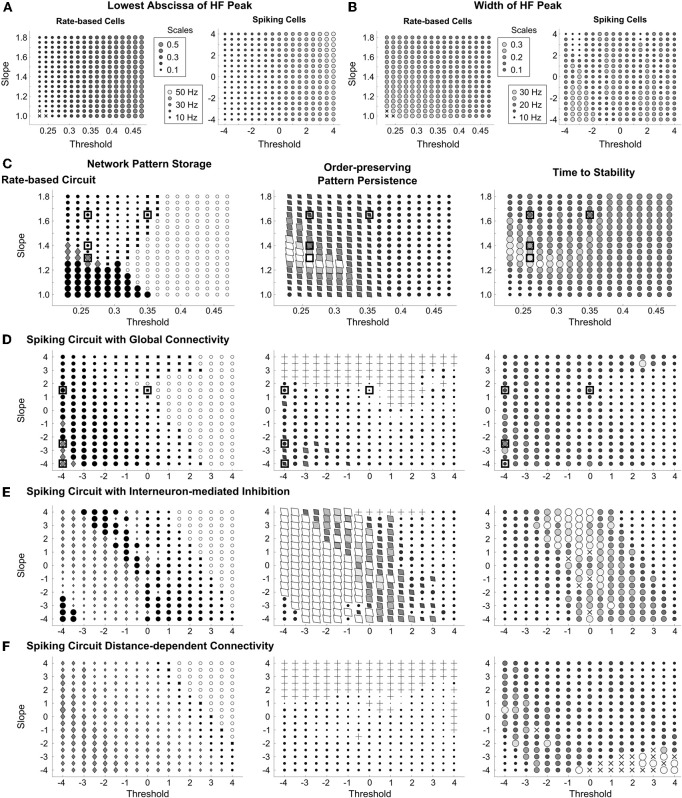
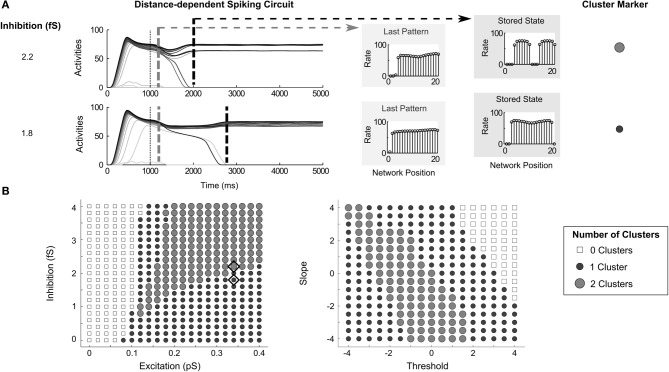
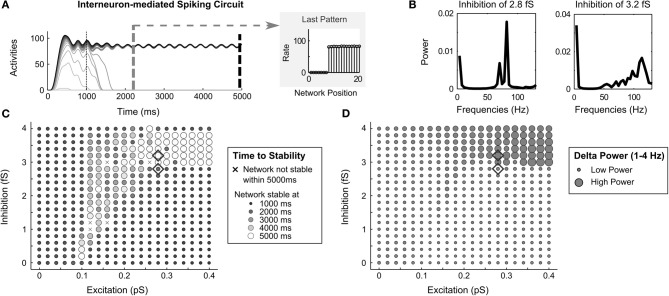
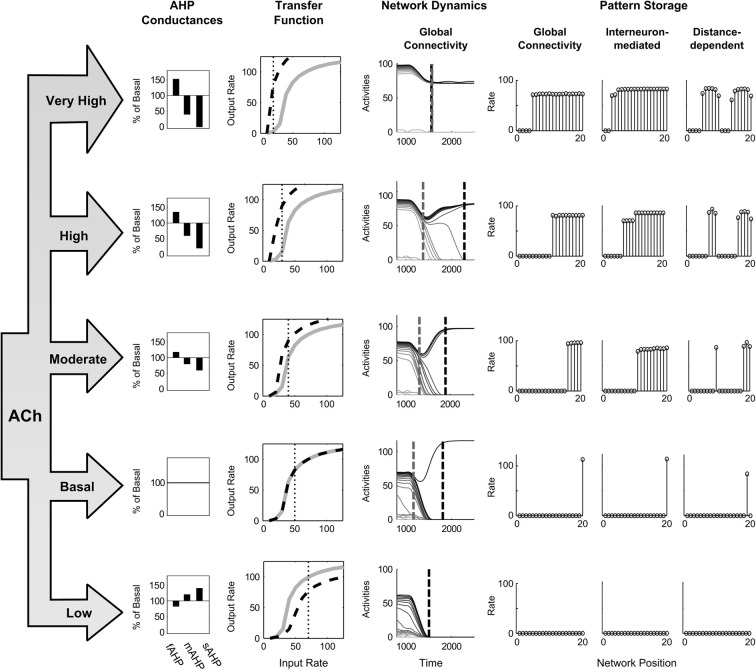
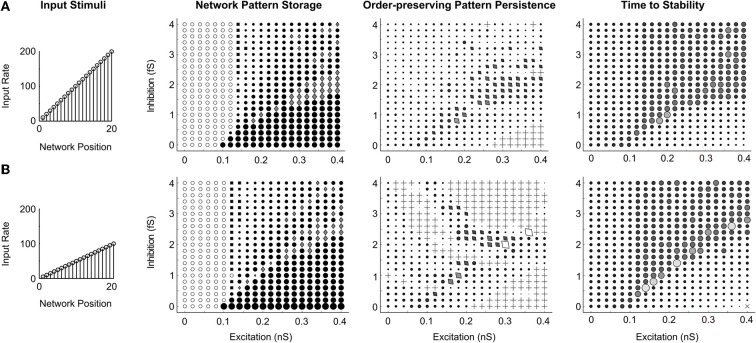
Many cortical networks contain recurrent architectures that transform input patterns before storing them in short-term memory (STM). Theorems in the 1970's showed how feedback signal functions in rate-based recurrent on-center off-surround networks control this process. A sigmoid signal function induces a quenching threshold below which inputs are suppressed as noise and above which they are contrast-enhanced before pattern storage. This article describes how changes in feedback signaling, neuromodulation, and recurrent connectivity may alter pattern processing in recurrent on-center off-surround networks of spiking neurons. In spiking neurons, fast, medium, and slow after-hyperpolarization (AHP) currents control sigmoid signal threshold and slope. Modulation of AHP currents by acetylcholine (ACh) can change sigmoid shape and, with it, network dynamics. For example, decreasing signal function threshold and increasing slope can lengthen the persistence of a partially contrast-enhanced pattern, increase the number of active cells stored in STM, or, if connectivity is distance-dependent, cause cell activities to cluster. These results clarify how cholinergic modulation by the basal forebrain may alter the vigilance of category learning circuits, and thus their sensitivity to predictive mismatches, thereby controlling whether learned categories code concrete or abstract features, as predicted by Adaptive Resonance Theory. The analysis includes global, distance-dependent, and interneuron-mediated circuits. With an appropriate degree of recurrent excitation and inhibition, spiking networks maintain a partially contrast-enhanced pattern for 800 ms or longer after stimuli offset, then resolve to no stored pattern, or to winner-take-all (WTA) stored patterns with one or multiple winners. Strengthening inhibition prolongs a partially contrast-enhanced pattern by slowing the transition to stability, while strengthening excitation causes more winners when the network stabilizes.

Keywords: Adaptive Resonance Theory; acetylcholine modulation; after-hyperpolarization current; pattern processing; short-term memory; sigmoid signal; spiking neuron; vigilance.


Figures

Figure 1
Figure 1
Recurrent on-center off-surround shunting networks and their modulation. Four recurrent circuits are depicted: (A) a rate-based recurrent circuit analyzed in Grossberg, (B) a spiking recurrent circuit in which principle pyramidal cells connect directly to each other (C) a spiking recurrent circuit in which inhibition is mediated indirectly by interneurons (D) a spiking recurrent circuit in which connection weights are distance-dependent, specifically scaled by a Gaussian of distance. (E,F) Two diagrams depict how all four circuits show qualitatively similar dependence on (E) the strength of recurrent connectivity and (F) the shape of cellular transfer functions. The diagrams are conceptual synopses of the network dynamics across the various circuit types. Light gray signifies gradual dynamics, medium gray indicates fast dynamics and small stored patterns, dark gray indicates fast dynamics and large stored patterns.
Figure 2
Figure 2
Dynamics of signal functions control pattern in a recurrent architecture. (A) How the choice of four different non-linear signal functions determines network storage behavior including whether noise is amplified or suppressed (Grossberg, 1973). The sigmoidal case is noteworthy, because it features a quenching threshold which enables noise suppression and partially contrast-enhanced activity patterns to be stored in STM. Modulation of the quenching threshold enables the number of stored items to be varied. (B) To analyze the resultant network activity patterns, cells are labeled as winners or survivors, based on whether their activity relative to the network overcomes a winning threshold (WT) or a surviving threshold (ST). (C) Once the network stabilizes after stimulation has ceased, the network pattern can be classified as no pattern storage, partial contrast enhancement, or winner-take-all. A venn diagram of the cell activities and an example (Ex) of a stored pattern are shown for each case.
Figure 3
Figure 3
Partial contrast-enhanced pattern sustained in short-term memory. (A) A simulation trial consists of one second of stimulus (Stim) presentation and four seconds to evaluate STM storage; (B) the ramp stimulus of increasing input rates at each successive network position; (C) raster of output spikes in a 20 cell network; (D) the transfer function, the thick black dashed line, for the cells in this example superimposed over the transfer function, shown in gray, that was used under normal conditions; that is, with the AHP conductances in Table 2. The vertical thin dotted line across the transfer function is drawn at the lowest abscissa of the cell's hill function; (E) output firing rates estimated by windowing the spikes. Vertical dashed gray and dashed black lines across the activities denote the last time of the highly distributed partially contrast-enhanced pattern and the time when the network stabilizes on STM storage of a much small number of activities, respectively. The vertical thin dotted line demarks the time of stimulus offset. Note that the distributed pattern can be maintained for over a second, which is within the duration of many STM functions; (F) pattern storage after the input pattern ends, evaluated 1000 ms and 4000 ms after input termination. The simulated network is a spiking circuit with interneuron-mediated inhibition, where the excitation and inhibition are 0.14 pS and 4 fS, and the AHP conductances are changed, such that threshold and slope are −1.5 and −4.0, respectively.
Figure 4
Figure 4
Modulating the strength of recurrent inhibition and excitation. Increasing the strength of inhibitory recurrence reduces the number of cells in the stored network pattern, while increasing excitatory recurrence reverses the effect. (A,C,E) For a spiking circuit with global connectivity, pattern storage shifts from WTA with many winners, 18 in (A), to less winners, 12 and 1 in (C,E), for inhibitory strengths of 0.4 fS, 0.8 fS, and 3.2 fS, respectively. (B,D,F) For the rate-based circuit, pattern storage similarly shifts from WTA with 15 winners to six winners, then to 1 winner for inhibitory strengths of 0.05, 0.1, and 0.45. Vertical dashed gray and dashed black lines across the activities denote the time of the last broadly distributed partially contrast-enhanced pattern and the time when the network stabilizes on its storage state, respectively. The vertical thin dotted line demarks the time of stimulus offset. The right plots show the (spike) rates across the network positions at those two times, labeled the last pattern and the stored state. (G) For the spiking circuit, by increasing recurrent excitation to 0.38 pS, pattern storage shifts from a WTA pattern with a single winner back up to multiple-winners (9). (H) For the rate-based circuit, by increasing recurrent excitation to 0.45, pattern storage shifts from a WTA with a single winner back up to three winners.
Figure 5
Figure 5
Parametric maps of connectivity strengths for various circuits. Network dynamics following temporary input stimulation show a similar dependence on the strengths of the recurrent excitatory and inhibitory connections. (A) The key for parts (B–E): the left column characterizes the type of network pattern storage at the end of the simulation time, the size of black circles indicating the number of winners, while the size of gray diamond indicates the number of non-winning survivors. The middle column describes the duration of order-preserving partial contrast-enhanced pattern persistence after the stimuli is removed. The right column summarizes the time until the network reaches stable pattern storage. Results for (B) the rate-based circuit, (C) the spiking circuit with global connectivity, (D) the spiking circuit with interneuron-mediated inhibition, and (E) the spiking circuit with distance-dependent connectivity. Parameters for individual simulations used in Figure 4 are highlighted by black squares. Recurrent parameters for Figures 6 and 7 are highlighted by black hexagons.
Figure 6
Figure 6
Pattern storage depends on sigmoid transfer function shape, changing the threshold and slope of the sigmoid transfer function by altering the conductances of AHP currents. (A) Decreasing threshold and (B) decreasing slope for the rate-based circuit, in parallel with (C) decreasing threshold and (D) decreasing slope for the spiking circuit with global connectivity. Left column shows the changes to the variables for threshold and slope. The resultant transfer functions and hill functions are depicted as black dashed lines over the corresponding functions under basal conditions shown in gray—that is with the strengths of AHP currents matching those in Table 2. Middle column depicts the activities of the network over the 5000 ms simulation. Dashed gray and dashed black lines across the activities denote the time of the last distributed partially contrast-enhanced pattern and the time when the network stabilizes on its storage state, respectively. The right plots show the rates across the network positions at those two times, labeled the last pattern and the stored state.
Figure 7
Figure 7
Parametric maps of transfer function modulation for various circuits. (A) The width of the hill function (HF) peak plotted as a function of threshold and slope for rate-based and spiking model excitatory cells; (B) the lowest abscissa value of the hill HF peak plotted as a function of threshold and slope for rate-based and spiking model cells; (C–F) these maps follow the same key and columns from Figure 5, but as a function of threshold and slope of the signal or transfer function. The left column characterizes the type of network pattern storage at the end of the simulation time. The middle column describes the duration of partially contrast-enhanced pattern persistence after the stimulus. The right column summarizes the time when the network reaches stable pattern storage. Results for (C) the rate-based circuit, (D) the spiking circuit with global connectivity, (E) the spiking circuit with interneuron-mediated inhibition, and (F) the spiking circuit with distance-dependent connectivity. Parameters for individual simulations used in Figure 6 are highlighted by black squares.
Figure 8
Figure 8
Clustering in distance-dependent circuit. (A) Network activities with inhibition set to 2.2 fS and 1.8 fS with excitation at 0.34pS. Dashed gray and dashed black lines denote the time of the last partially contrast-enhanced pattern and the time when the network stabilizes on its storage state, respectively. The right plots show the rates across the network positions at those two times, the last pattern, and the stored stable state; (B) the number of STM clusters in the network at steady state over parametric changes in recurrent excitatory and inhibitory strengths (left) as well as changes in transfer function (right). Diamonds indicate the parameters used for (A). Since the architecture is a ring network, clusters can span the connection between the cell with index 1 to the last cell with index 20.
Figure 9
Figure 9
Oscillations in interneuron-mediated circuit. (A) a network oscillation of about 3.7 Hz in the Delta range (1–4 Hz) in the spike rate activities in the interneuron-mediated spiking circuit when the recurrent excitatory and inhibitory is strong; (B) Fourier analysis of average network frequencies over the entire 5000 ms simulation with inhibition of 3.2 fS and 2.8 fS; (C) the time to network stability; and (D) the average Delta power as a function of recurrent excitatory and inhibitory strengths. Diamonds denote corresponding parameters to the frequency plots in (B).
Figure 10
Figure 10
Changing the cholinergic modulation. The left side shows the behavioral levels of Acetylcholine, the corresponding changes in the three AHP currents, and the resultant transfer function shapes for the pyramidal spiking cell model. The right side depicts network dynamics at these ACh levels and the resulting STM stored states. Dashed gray and dashed black lines across the activities denote the time of the last partially contrast-enhanced pattern and the time when the network stabilizes on its storage state, respectively. The right plots show the rates across the network positions at those two times, the last pattern and the stored state.
Figure 11
Figure 11
Processing with different stimuli strength. Parametric maps, as in Figure 5, indicate the type of network pattern storage at the end of the simulation time, the duration of partial contrast-enhanced pattern persistence after the stimuli is removed, and the time until the network reaches stable pattern storage: (A) for a ramp stimuli of input rates up to 200 Hz (shown before); and (B) for a ramp stimuli of half the magnitude with input rates up to 100 Hz.

Similar articles

Cited by

References

    1. Abel H. J., Lee J. C. F., Callaway J. C., Foehring R. C. (2004). Relationships between intracellular calcium and afterhyperpolarizations in neocortical pyramidal neurons. J. Neurophysiol. 91, 324–335 10.1152/jn.00583.2003 - DOI - PubMed
    1. Akins P. T., Surmeier D. J., Kitai S. T. (1990). Muscarinic modulation of a transient K+ conductance in rat neostriatal neurons. Nature 344, 240–242 10.1038/344240a0 - DOI - PubMed
    1. Arnold H. M., Burk J. A., Hodgson E. M., Sarter M., Bruno J. P. (2002). Differential cortical acetylcholine release in rats performing a sustained attention task versus behavioral control tasks that do not explicitly tax attention. Neuroscience 114, 451–460 10.1016/S0306-4522(02)00292-0 - DOI - PubMed
    1. Atri A., Sherman S., Norman K. A., Kirchhoff B. A., Nicolas M. M., Greicius M. D., Cramer S. C., Breiter H. C., Hasselmo M. E., Stern C. E. (2004). Blockade of central cholinergic receptors impairs new learning and increases proactive interference in a word paired-associate memory task. Behav. Neurosci. 118, 223–236 10.1037/0735-7044.118.1.223 - DOI - PubMed
    1. Ballaz S. J. (2009). Differential novelty detection in rats selectively bred for novelty-seeking behavior. Neurosci. Lett. 461, 45–48 10.1016/j.neulet.2009.05.066 - DOI - PMC - PubMed

LinkOut - more resources