

Immunoglobulin analysis tool: a novel tool for the analysis of human and mouse heavy and light chain transcripts
- PMID: 22754554
- PMCID: PMC3384897
- DOI: 10.3389/fimmu.2012.00176
Immunoglobulin analysis tool: a novel tool for the analysis of human and mouse heavy and light chain transcripts
Abstract
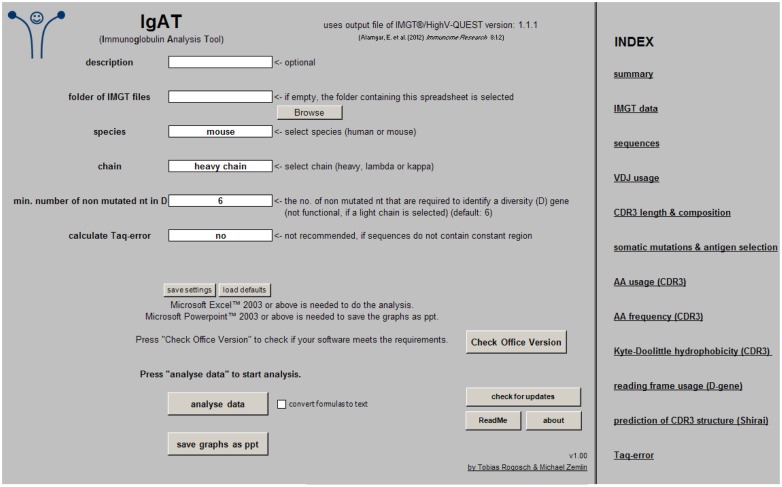
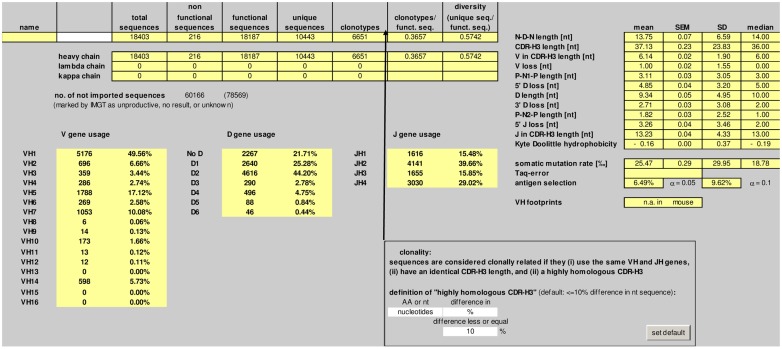
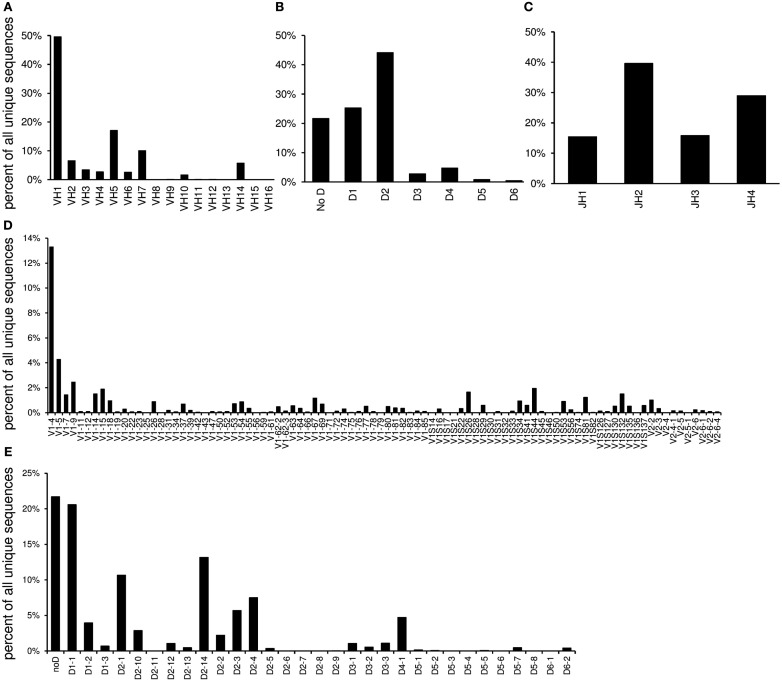
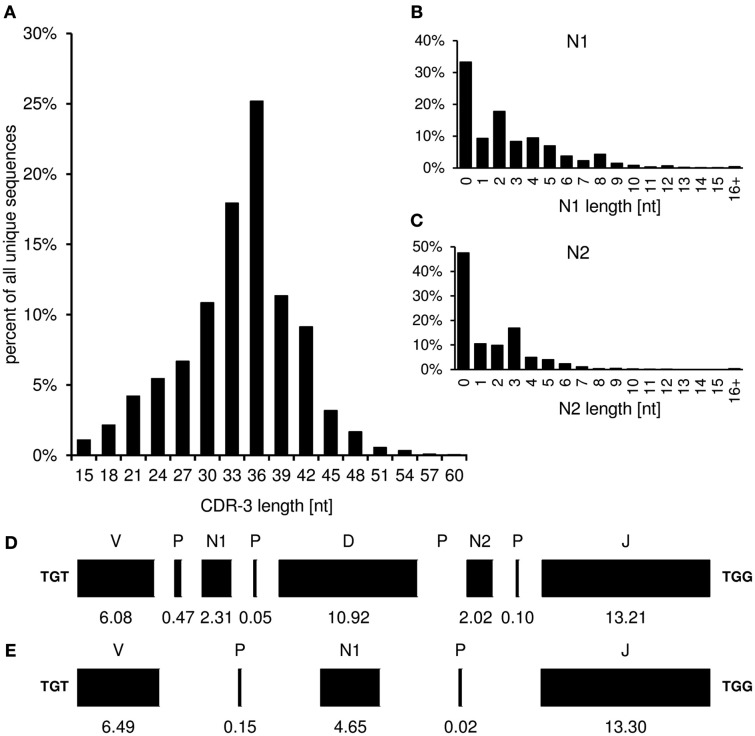
Sequence analysis of immunoglobulin (Ig) heavy and light chain transcripts can refine categorization of B cell subpopulations and can shed light on the selective forces that act during immune responses or immune dysregulation, such as autoimmunity, allergy, and B cell malignancy. High-throughput sequencing yields Ig transcript collections of unprecedented size. The authoritative web-based IMGT/HighV-QUEST program is capable of analyzing large collections of transcripts and provides annotated output files to describe many key properties of Ig transcripts. However, additional processing of these flat files is required to create figures, or to facilitate analysis of additional features and comparisons between sequence sets. We present an easy-to-use Microsoft(®) Excel(®) based software, named Immunoglobulin Analysis Tool (IgAT), for the summary, interrogation, and further processing of IMGT/HighV-QUEST output files. IgAT generates descriptive statistics and high-quality figures for collections of murine or human Ig heavy or light chain transcripts ranging from 1 to 150,000 sequences. In addition to traditionally studied properties of Ig transcripts - such as the usage of germline gene segments, or the length and composition of the CDR-3 region - IgAT also uses published algorithms to calculate the probability of antigen selection based on somatic mutational patterns, the average hydrophobicity of the antigen-binding sites, and predictable structural properties of the CDR-H3 loop according to Shirai's H3-rules. These refined analyses provide in-depth information about the selective forces acting upon Ig repertoires and allow the statistical and graphical comparison of two or more sequence sets. IgAT is easy to use on any computer running Excel(®) 2003 or higher. Thus, IgAT is a useful tool to gain insights into the selective forces and functional properties of small to extremely large collections of Ig transcripts, thereby assisting a researcher to mine a data set to its fullest.
Keywords: antibody repertoire; deep sequencing; high-throughput analysis; immunoglobulin heavy chain gene; immunoglobulin light chain gene; rearrangement; sequence analysis software; somatic mutation.
Figures
Similar articles
-
Comparative analysis of human and mouse immunoglobulin variable heavy regions from IMGT/LIGM-DB with IMGT/HighV-QUEST.Theor Biol Med Model. 2014 Jul 3;11:30. doi: 10.1186/1742-4682-11-30. Theor Biol Med Model. 2014. PMID: 24992938 Free PMC article.
-
IMGT(®) tools for the nucleotide analysis of immunoglobulin (IG) and T cell receptor (TR) V-(D)-J repertoires, polymorphisms, and IG mutations: IMGT/V-QUEST and IMGT/HighV-QUEST for NGS.Methods Mol Biol. 2012;882:569-604. doi: 10.1007/978-1-61779-842-9_32. Methods Mol Biol. 2012. PMID: 22665256
-
IG and TR single chain fragment variable (scFv) sequence analysis: a new advanced functionality of IMGT/V-QUEST and IMGT/HighV-QUEST.BMC Immunol. 2017 Jun 26;18(1):35. doi: 10.1186/s12865-017-0218-8. BMC Immunol. 2017. PMID: 28651553 Free PMC article.
-
Affinity war: forging immunoglobulin repertoires.Curr Opin Immunol. 2019 Apr;57:32-39. doi: 10.1016/j.coi.2018.12.002. Epub 2019 Jan 25. Curr Opin Immunol. 2019. PMID: 30690255 Free PMC article. Review.
-
Avian B-cell development: generation of an immunoglobulin repertoire by gene conversion.Annu Rev Immunol. 1991;9:219-41. doi: 10.1146/annurev.iy.09.040191.001251. Annu Rev Immunol. 1991. PMID: 1910677 Review.
Cited by
-
The Diagnostic and Prognostic Potential of the B-Cell Repertoire in Membranous Nephropathy.Front Immunol. 2021 May 27;12:635326. doi: 10.3389/fimmu.2021.635326. eCollection 2021. Front Immunol. 2021. PMID: 34122405 Free PMC article.
-
The same self-peptide selects conventional and regulatory CD4⁺ T cells with identical antigen receptors.Nat Commun. 2014 Oct 1;5:5061. doi: 10.1038/ncomms6061. Nat Commun. 2014. PMID: 25270305 Free PMC article.
-
Evaluation of the Antigen-Experienced B-Cell Receptor Repertoire in Healthy Children and Adults.Front Immunol. 2016 Oct 17;7:410. doi: 10.3389/fimmu.2016.00410. eCollection 2016. Front Immunol. 2016. PMID: 27799928 Free PMC article.
-
V(D)J Rearrangement Is Dispensable for Producing CDR-H3 Sequence Diversity in a Gene Converting Species.Front Immunol. 2018 Jun 11;9:1317. doi: 10.3389/fimmu.2018.01317. eCollection 2018. Front Immunol. 2018. PMID: 29951062 Free PMC article.
-
Characterization of T and B cell repertoire diversity in patients with RAG deficiency.Sci Immunol. 2016 Dec 16;1(6):eaah6109. doi: 10.1126/sciimmunol.aah6109. Epub 2016 Dec 16. Sci Immunol. 2016. PMID: 28783691 Free PMC article.
References
-
- Alamyar E., Giudicelli V., Li S., Duroux P., Lefranc M. P. (2012). IMGT/HighV-QUEST: the IMGT® web portal for immunoglobulin (IG) or antibody and T cell receptor (TR) analysis from NGS high throughput and deep sequencing. Immunome Res. 8, 26. - PubMed
LinkOut - more resources
Full Text Sources
Other Literature Sources