

Genotype Imputation for Latinos Using the HapMap and 1000 Genomes Project Reference Panels
- PMID: 22754564
- PMCID: PMC3384355
- DOI: 10.3389/fgene.2012.00117
Genotype Imputation for Latinos Using the HapMap and 1000 Genomes Project Reference Panels
Abstract
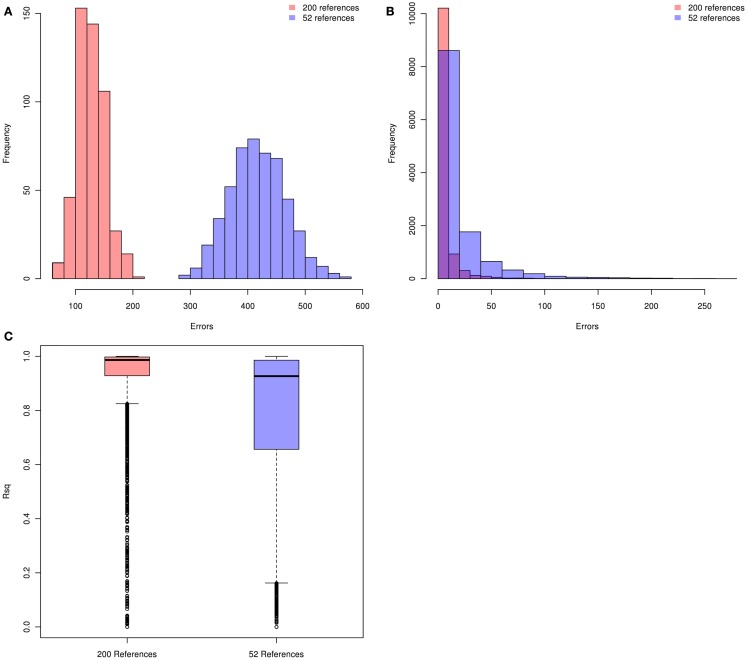
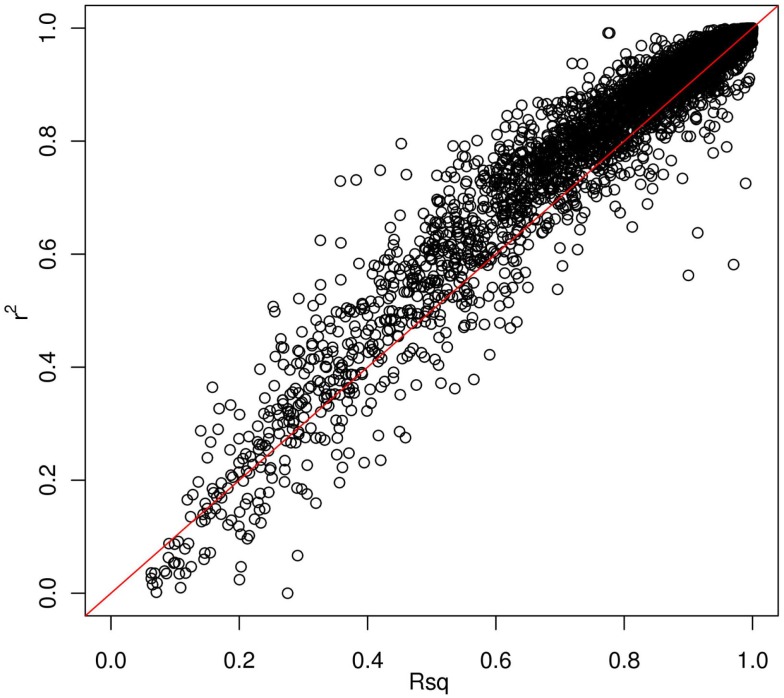
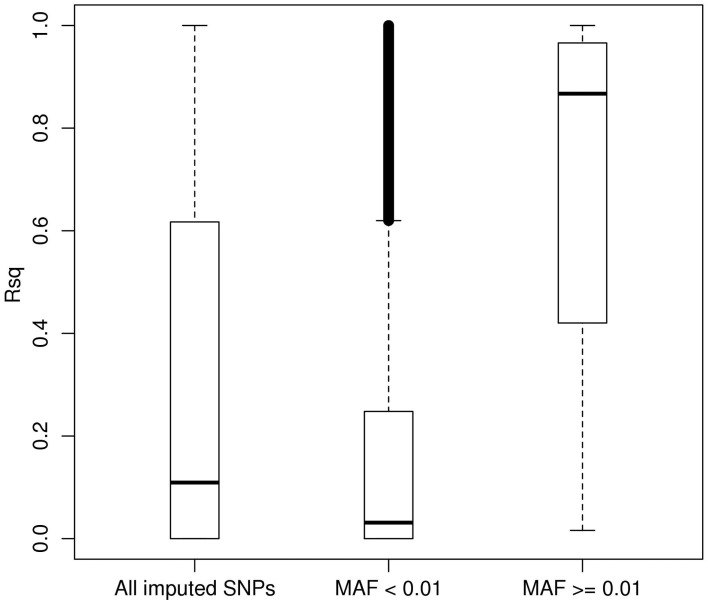
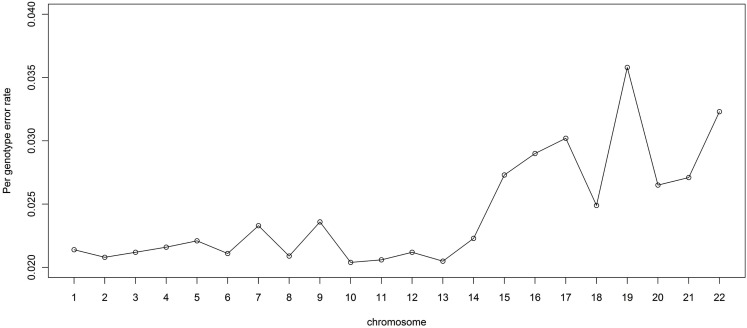
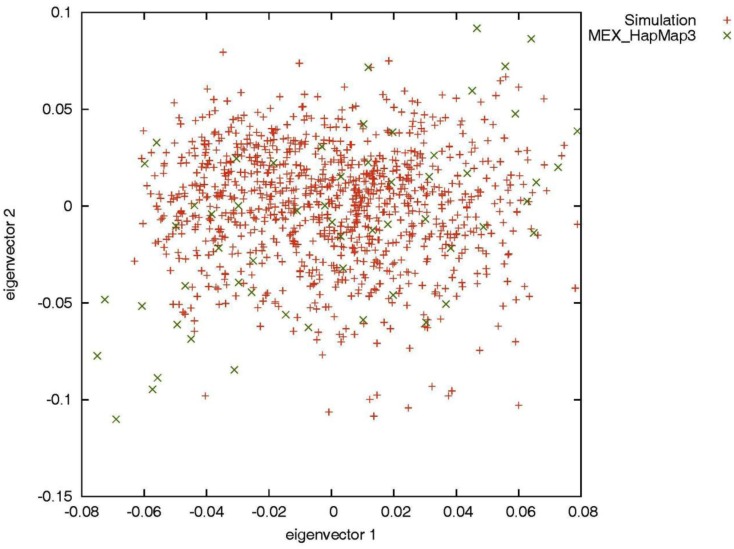
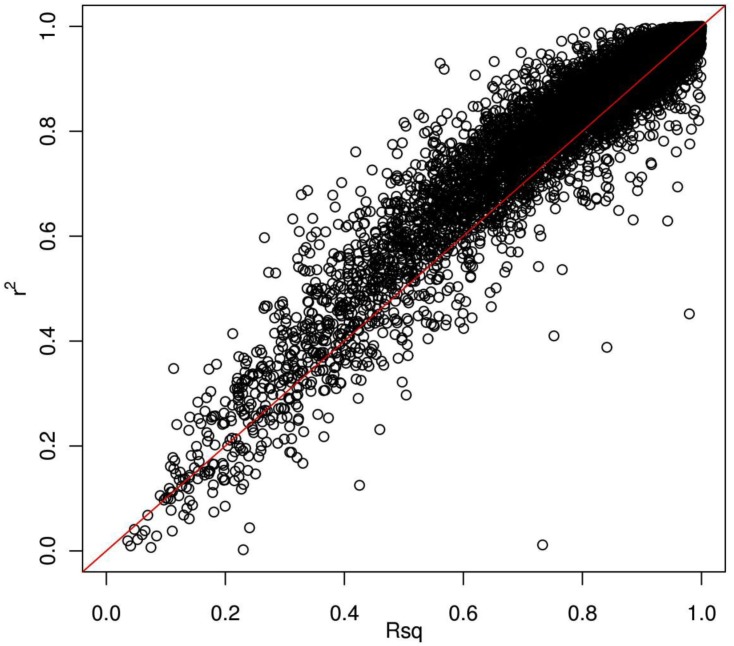
Genotype imputation is a vital tool in genome-wide association studies (GWAS) and meta-analyses of multiple GWAS results. Imputation enables researchers to increase genomic coverage and to pool data generated using different genotyping platforms. HapMap samples are often employed as the reference panel. More recently, the 1000 Genomes Project resource is becoming the primary source for reference panels. Multiple GWAS and meta-analyses are targeting Latinos, the most populous, and fastest growing minority group in the US. However, genotype imputation resources for Latinos are rather limited compared to individuals of European ancestry at present, largely because of the lack of good reference data. One choice of reference panel for Latinos is one derived from the population of Mexican individuals in Los Angeles contained in the HapMap Phase 3 project and the 1000 Genomes Project. However, a detailed evaluation of the quality of the imputed genotypes derived from the public reference panels has not yet been reported. Using simulation studies, the Illumina OmniExpress GWAS data from the Los Angles Latino Eye Study and the MACH software package, we evaluated the accuracy of genotype imputation in Latinos. Our results show that the 1000 Genomes Project AMR + CEU + YRI reference panel provides the highest imputation accuracy for Latinos, and that also including Asian samples in the panel can reduce imputation accuracy. We also provide the imputation accuracy for each autosomal chromosome using the 1000 Genomes Project panel for Latinos. Our results serve as a guide to future imputation based analysis in Latinos.
Keywords: 1000 Genomes Project; HapMap Project; Latino; genotype imputation.
Figures
Similar articles
-
Comprehensive evaluation of imputation performance in African Americans.J Hum Genet. 2012 Jul;57(7):411-21. doi: 10.1038/jhg.2012.43. Epub 2012 May 31. J Hum Genet. 2012. PMID: 22648186 Free PMC article.
-
Performance of genotype imputations using data from the 1000 Genomes Project.Hum Hered. 2012;73(1):18-25. doi: 10.1159/000334084. Epub 2011 Dec 30. Hum Hered. 2012. PMID: 22212296 Free PMC article.
-
Assessment of genotype imputation performance using 1000 Genomes in African American studies.PLoS One. 2012;7(11):e50610. doi: 10.1371/journal.pone.0050610. Epub 2012 Nov 30. PLoS One. 2012. PMID: 23226329 Free PMC article.
-
Genotype Imputation in Genome-Wide Association Studies.Curr Protoc Hum Genet. 2019 Jun;102(1):e84. doi: 10.1002/cphg.84. Curr Protoc Hum Genet. 2019. PMID: 31216114 Review.
-
Genotype Imputation from Large Reference Panels.Annu Rev Genomics Hum Genet. 2018 Aug 31;19:73-96. doi: 10.1146/annurev-genom-083117-021602. Epub 2018 May 23. Annu Rev Genomics Hum Genet. 2018. PMID: 29799802 Review.
Cited by
-
Genetic signature to provide robust risk assessment of psoriatic arthritis development in psoriasis patients.Nat Commun. 2018 Oct 9;9(1):4178. doi: 10.1038/s41467-018-06672-6. Nat Commun. 2018. PMID: 30301895 Free PMC article.
-
Prediction of complex human diseases from pathway-focused candidate markers by joint estimation of marker effects: case of chronic fatigue syndrome.Hum Genomics. 2015 Jun 11;9(1):8. doi: 10.1186/s40246-015-0030-6. Hum Genomics. 2015. PMID: 26063326 Free PMC article.
-
Genome-wide association study identifies WNT7B as a novel locus for central corneal thickness in Latinos.Hum Mol Genet. 2016 Nov 15;25(22):5035-5045. doi: 10.1093/hmg/ddw319. Hum Mol Genet. 2016. PMID: 28171582 Free PMC article.
-
Challenges in conducting genome-wide association studies in highly admixed multi-ethnic populations: the Generation R Study.Eur J Epidemiol. 2015 Apr;30(4):317-30. doi: 10.1007/s10654-015-9998-4. Epub 2015 Mar 12. Eur J Epidemiol. 2015. PMID: 25762173 Free PMC article.
-
A Pipeline for Phasing and Genotype Imputation on Mixed Human Data (Parents-Offspring Trios and Unrelated Subjects) by Reviewing Current Methods and Software.Life (Basel). 2022 Dec 5;12(12):2030. doi: 10.3390/life12122030. Life (Basel). 2022. PMID: 36556394 Free PMC article. Review.
References
-
- Altshuler D. M., Gibbs R. A., Peltonen L., Dermitzakis E., Schaffner S. F., Yu F., Bonnen P. E., De Bakker P. I., Deloukas P., Gabriel S. B., Gwilliam R., Hunt S., Inouye M., Jia X., Palotie A., Parkin M., Whittaker P., Chang K., Hawes A., Lewis L. R., Ren Y., Wheeler D., Muzny D. M., Barnes C., Darvishi K., Hurles M., Korn J. M., Kristiansson K., Lee C., Mccarrol S. A., Nemesh J., Keinan A., Montgomery S. B., Pollack S., Price A. L., Soranzo N., Gonzaga-Jauregui C., Anttila V., Brodeur W., Daly M. J., Leslie S., Mcvean G., Moutsianas L., Nguyen H., Zhang Q., Ghori M. J., Mcginnis R., Mclaren W., Takeuchi F., Grossman S. R., Shlyakhter I., Hostetter E. B., Sabeti P. C., Adebamowo C. A., Foster M. W., Gordon D. R., Licinio J., Manca M. C., Marshall P. A., Matsuda I., Ngare D., Wang V. O., Reddy D., Rotimi C. N., Royal C. D., Sharp R. R., Zeng C., Brooks L. D., Mcewen J. E. (2010). Integrating common and rare genetic variation in diverse human populations. Nature 467, 52–5810.1038/nature09298 - DOI - PMC - PubMed
Grants and funding
LinkOut - more resources
Full Text Sources