Review
. 2012 May;4(5):777-99.
doi: 10.3390/v4050777. Epub 2012 May 4.

Quantitative live-cell imaging of human immunodeficiency virus (HIV-1) assembly

Affiliations
Review

Quantitative live-cell imaging of human immunodeficiency virus (HIV-1) assembly

Viola Baumgärtel et al. Viruses. 2012 May.

Abstract

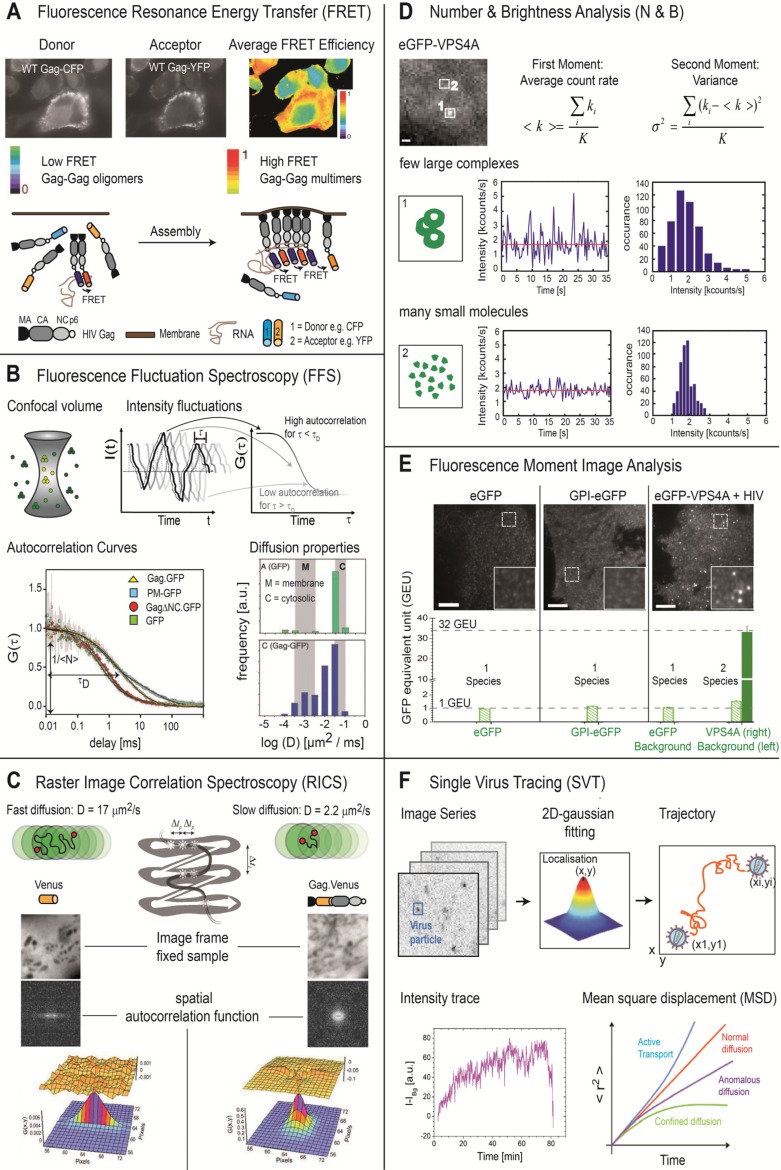
Advances in fluorescence methodologies make it possible to investigate biological systems in unprecedented detail. Over the last few years, quantitative live-cell imaging has increasingly been used to study the dynamic interactions of viruses with cells and is expected to become even more indispensable in the future. Here, we describe different fluorescence labeling strategies that have been used to label HIV-1 for live cell imaging and the fluorescence based methods used to visualize individual aspects of virus-cell interactions. This review presents an overview of experimental methods and recent experiments that have employed quantitative microscopy in order to elucidate the dynamics of late stages in the HIV-1 replication cycle. This includes cytosolic interactions of the main structural protein, Gag, with itself and the viral RNA genome, the recruitment of Gag and RNA to the plasma membrane, virion assembly at the membrane and the recruitment of cellular proteins involved in HIV-1 release to the nascent budding site.

Keywords: ESCRT, live-cell imaging; HIV; assembly; fluorescence; microscopy.


Figures

Figure 1
Figure 1
Selective methods for quantitative fluorescence analysis of HIV-1 assembly. Numerous fluorescence methods are available for investigating the dynamics of viral processes and virus-cell interactions. A few of them are highlighted in the figure. (A) FRET can be used to investigate the spatial distribution of molecular interactions in live cells. Using Gag.CFP and Gag.YFP, Hogue et al. investigated the interaction of WT and mutant Gag molecules in the cytosol and plasma membrane using FRET [18]. (B) FFS uses fluctuations in fluorescence intensity to determine the mobility of fluorescently labeled molecules. From FFS experiments on GFP-tagged Gag with deletion of the nucleocapsid (NC) domain, plasma membrane bound GFP, and cytosolic GFP, Larson et al. demonstrated that the mobility of Gag is significantly decreased in the plasma membrane as shown by the shift in the correlation curve to longer times. Thus, with FFS, they could investigate the role of NC in the assembly process [19]. (C) RICS measures the mobility of fluorescence molecules by utilizing the correlations between pixels in a raster‑scanned image. The RICS autocorrelation function for Venus (left) and Venus‑labeled Gag (right) are shown. (D) N&B Analysis determines the number and molecular brightness of the labeled biomolecules from the fluctuations in fluorescence intensity over time. A small number of large bright complexes will show a larger variance in the measured fluorescence intensity than a larger number of dim molecules, even though the average fluorescence intensity may be similar. (E) Fluorescence moment image analysis uses the fluorescence intensity distribution of an image to determine the number and brightness of complexes in the image. A higher-order moment analysis was performed by Baumgärtel et al. to estimate the number of VPS4 molecules that interact with nascent HIV-1 assembly sites [20]. (F) SVT can be used to following individual viruses as they enter or exit living cells. The position of the virus is determined in each frame by fitting the point-spread function to a 2D Gaussian, yielding the trajectory. From the trajectory information, the fluorescence intensity during the trajectory or the diffusional behavior can be determined [21].
Figure 2
Figure 2
Architecture of the HIV-1 budding site and of released particles. (A) Electron micrograph of a HIV-1 budding site showing immature and mature virions at the plasma membrane of a virus producing T-cell. Scale bar 100 nm. (B) Schematic representation of the structures shown in (A).
Figure 3
Figure 3
Imaging Gag assembly at the plasma membrane by wide-field (WF) and TIRF microscopy.(A) A HeLa cell expressing HIV.eGFP was imaged in WF (left) and TIRF (right) mode 25 hours post transfection; Scale bar, 5 µm (B) 2D trajectory of one single HIV-1 particle during assembly color coded according to the three different assembly phases shown in C; Scale bar, 1 µm. (C) Average background corrected WF (grey) and TIRF (colored) intensity traces (top) and instantaneous velocity plot (bottom) illustrating the three phases of HIV-1 assembly: phase I (red), a rapid increase in intensity and nearly no movement; phase II (yellow), an intensity plateau with slow movement; phase III (blue), a decrease in intensity correlated with a strong increase in movement or disappearance of the viral particle. (D) Mean square displacement (MSD) plot clearly showing the change in motional behavior from phase I/II to phase III, defining the release time point. All images adopted from Ivanchenko et al. [38].
Figure 4
Figure 4
Interaction of VPS4 with HIV-1 assembly sites. (A) Model illustrating the interaction of the AAA-ATPase VPS4 during the three different HIV-1 assembly phases, based on several independent experimental studies including recent live-cell imaging results from Baumgärtel et al. [20] and Jouvenet et al. [39]. (B) Average kinetic scheme for Gag.mCherry assembly derived from experimental data (top). Histogram of time points during which VPS4A-Gag interactions and ATPase activity could be monitored at the membrane (bottom). The majority of VPS4A activity took place during phase II of the assembly process before the actual release of the virus [20]. Figure adapted from Baumgärtel et al. [92].

References

    1. Briggs J.A., Kräusslich H.G. The molecular architecture of HIV. J. Mol. Biol. 2011;410:491–500. - PubMed
    1. Weiss E.R., Göttlinger H. The role of cellular factors in promoting HIV budding. J. Mol. Biol. 2011;410:525–533. - PMC - PubMed
    1. Andresen M., Stiel A., Fölling J., Wenzel D., Schönle A., Egner A., Eggeling C., Hell S., Jakobs S. Photoswitchable fluorescent proteins enable monochromatic multilabel imaging and dual color fluorescence nanoscopy. Nat. Biotechnol. 2008;26:1035–1040. - PubMed
    1. Shaner N.C., Campbell R.E., Steinbach P.A., Giepmans B.N., Palmer A.E., Tsien R.Y. Improved monomeric red, orange and yellow fluorescent proteins derived from Discosoma sp. red fluorescent protein. Nat. Biotechnol. 2004;22:1567–1572. doi: 10.1038/nbt1037. - DOI - PubMed
    1. Tsien R.Y. The green fluorescent protein. Annu. Rev. Biochem. 1998;67:509–544. - PubMed

Publication types

Substances

LinkOut - more resources