. 2012 Jul 1;1(4):409-418.
doi: 10.4161/onci.18851.

TIL therapy broadens the tumor-reactive CD8(+) T cell compartment in melanoma patients

Affiliations

TIL therapy broadens the tumor-reactive CD8(+) T cell compartment in melanoma patients

Pia Kvistborg et al. Oncoimmunology. .

Abstract

There is strong evidence that both adoptive T cell transfer and T cell checkpoint blockade can lead to regression of human melanoma. However, little data are available on the effect of these cancer therapies on the tumor-reactive T cell compartment. To address this issue we have profiled therapy-induced T cell reactivity against a panel of 145 melanoma-associated CD8(+) T cell epitopes. Using this approach, we demonstrate that individual tumor-infiltrating lymphocyte cell products from melanoma patients contain unique patterns of reactivity against shared melanoma-associated antigens, and that the combined magnitude of these responses is surprisingly low. Importantly, TIL therapy increases the breadth of the tumor-reactive T cell compartment in vivo, and T cell reactivity observed post-therapy can almost in full be explained by the reactivity observed within the matched cell product. These results establish the value of high-throughput monitoring for the analysis of immuno-active therapeutics and suggest that the clinical efficacy of TIL therapy can be enhanced by the preparation of more defined tumor-reactive T cell products.


Figures

None
Figure 1. Melanoma-specific CD8+ T cell reactivities within TIL infusion products. (A) Examples of flow cytometry plots displaying fluorescence intensity for Meloe-1TLN, MART-1ELA, SSX-2KAS and MAGE A10GLY pMHC multimer-reactive cells in TIL samples from two patients. Dot plots were gated on approximately 500,000 CD8+ lymphocytes. Grey dots represent CD8+ T cells with no pMHC multimer binding, blue dots represent pMHC multimer–reactive CD8+ T cells. Plots are shown with bi-exponential axes. Values indicate the % of antigen-specific T cells out of total CD8+ T cells. (B) Summary of antigen-specific T-cell populations identified in HLA-A2+ NIH and Ella TIL infusion products. The presence of antigen-specific T cell populations is indicated by the colored boxes, with the different colors reflecting antigen-specific CD8+ T-cell response magnitude. Only those epitopes are shown for which T-cell reactivity was detected in at least one patient sample. Patient numbers on top row, clinical responses on bottom row. PR, partial response; NR, no response.
None
Figure 2. Selection for tumor-reactive TIL does not lead to enhanced frequencies of shared melanoma-antigen reactive CD8+ T cells. Summary of antigen-specific T cell populations identified in HLA-A2+ NIH and Ella “selected TIL” infusion products. TIL were selected on the basis of IFNγ production in the supernatant upon culturing with autologous or shared melanoma lines. The presence of antigen-specific T-cell populations is indicated by the colored boxes, with the different colors reflecting antigen-specific CD8+ T cell response magnitude (see Figure 1B for key). Only those epitopes are shown for which T cell reactivity was detected in at least one patient sample. Clinical responses are summarized in the last row. CR, complete response; PR, partial response; NR, no response.
None
Figure 3. Validation of low-frequency T-cell populations detected in TIL. (A) MART-1, gp100, MAGE A10, SSX-2 expression by fresh tumor cells was measured by quantitative RT-PCR and correlated with the antigen-reactivities detected in matched TIL. Dark blue: tumor cells express the antigen and antigen-specific T cell population detected in the TIL infusion product. Light blue: tumor cells express the antigen, but no antigen-specific T cell population detected in the TIL infusion product. Red: tumor cells do not express the antigen, but antigen-specific T-cell population detected in the TIL infusion product. White: tumor cells do not express the antigen and antigen-specific T-cell population not detected in the TIL infusion product. (B) Intracellular IFNγ staining assay after co-culture of TIL with autologous melanoma cell lines (left axis) in comparison with the total frequency of CD8+ pMHC multimer+ identified (right axis). (C) Dot plot of MART-1ELA specific T-cell population in TIL of a recipient of MART-1 TCR-modified T cells. Value indicates the percentage of antigen-specific T cells out of total CD8+ T cells. (D) Summary of virus-specific T cell populations identified in six HLA-A2+ NIH and Ella TIL infusion products (see Figure 1B for key). (E) Dot plot of CDK4ACD-specific T-cell population detected in TIL. Value indicates the percentage of antigen-specific T cells out of total CD8+ T cells. (F) Intracellular IFNγ staining assay performed with FACS-sorted CDK4ACD-reactive T cells, with the cells being incubated either with T2 cells pulsed with or without the CDK4ACD peptide or an autologous tumor line (HLA-A2+). Melanoma cell lines 526 (HLA-A2+, CDK4R24C), 624 (HLA-A2+, CDK4WT), and 888 and 938 (HLA-A2-) were used as controls.
None
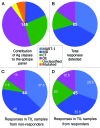
Figure 4. Contribution of antigen classes to T cell reactivity in TIL. (A) Contribution of the indicated antigen classes to the epitope panel. MD, melanoma differentiation antigens; CT, cancer/testis antigens; OE, overexpressed antigens; unclassified, antigens that cannot be designated to a specific class based on available data; mutated, mutated antigens. (B) Contribution of antigen classes to the antigen-reactive T-cell populations detected in both non-selected and selected TIL infusion products. (C and D) Contribution of antigen classes to the antigen-reactive T-cell populations detected in TIL infusion samples from clinical non-responders (C) and responders (D). The numbers in the center of the pie charts represent the total number of T-cell responses detected. The numbers within the individual pie sections indicate the percentage of T-cell responses in each category of all T-cell responses detected.
None
Figure 5. Melanoma-specific T cell reactivity identified in TIL products predicts T-cell reactivity post-therapy. (A) Summary of antigen-specific T-cell populations identified in one-month post-infusion PBMC samples (post) from NIH and Ella patients depicted together with the T-cell reactivities identified in the matched TIL infusion product (infusion). The presence of antigen-specific T-cell populations is indicated by the colored boxes, with the different colors reflecting antigen-specific CD8+ T-cell response magnitude. Only those epitopes are shown for which T-cell reactivity was detected in at least one patient sample. Patient numbers on top row, clinical responses on bottom row. CR, complete response; PR, partial response; NR, no response. (B) Relationship between melanoma-specific T-cell responses (% of total CD8+ T cells) detected in pre-therapy PBMC (pre), TIL infusion samples, and post-infusion PBMC (post) from seven NIH patients. Each square represents an antigen-specific T-cell population, each color represents T-cell responses detected within one patient (* p < 0.05)
None
Figure 6. Random variability in TIL composition during in vitro culture. Magnitude of antigen-specific T-cell populations (percent of total CD8+ T cells) in six different T-cell cultures originating from the same tumor digest of (A) patient NKI1 and (B) patient NKI2. T-cell cultures were initiated in separate wells (1–6) and cultured for approximately 2 weeks prior to analysis of T-cell reactivity.

References

    1. Pentcheva-Hoang T, Corse E, Allison JP. Negative regulators of T-cell activation: potential targets for therapeutic intervention in cancer, autoimmune disease, and persistent infections. Immunol Rev. 2009;229:67–87. doi: 10.1111/j.1600-065X.2009.00763.x. - DOI - PubMed
    1. Sznol M, Powderly JD, Smith DC, Brahmer JR, Drake CG, McDermott DF, et al. Safety and antitumor activity of biweekly MDX-1106 (Anti-PD-1, BMS-936558/ONO-4538) in patients with advanced refractory malignancies. ASCO Annual Meeting Proceedings 2010; 28:2506.
    1. Hodi FS, O’Day SJ, McDermott DF, Weber RW, Sosman JA, Haanen JB, et al. Improved survival with ipilimumab in patients with metastatic melanoma. N Engl J Med. 2010;363:711–23. doi: 10.1056/NEJMoa1003466. - DOI - PMC - PubMed
    1. Yang A, Kendle RF, Ginsberg BA, Roman R, Heine AI, Pogoriler E, et al. CTLA-4 blockade with ipilimumab increases peripheral CD8+ T cells: Correlation with clinical outcomes. ASCO Annual Meeting Proceedings 2010; 28:2555.
    1. Ribas A, Comin-Anduix B, Chmielowski B, Jalil J, de la Rocha P, McCannel TA, et al. Dendritic cell vaccination combined with CTLA4 blockade in patients with metastatic melanoma. Clin Cancer Res. 2009;15:6267–76. doi: 10.1158/1078-0432.CCR-09-1254. - DOI - PMC - PubMed

Publication types