. 2012 Jun;39(6):3112-23.
doi: 10.1118/1.4711815.

Automated measurement of uptake in cerebellum, liver, and aortic arch in full-body FDG PET/CT scans

Affiliations

Automated measurement of uptake in cerebellum, liver, and aortic arch in full-body FDG PET/CT scans

Christian Bauer et al. Med Phys. 2012 Jun.

Abstract

Purpose: The purpose of this work was to develop and validate fully automated methods for uptake measurement of cerebellum, liver, and aortic arch in full-body PET/CT scans. Such measurements are of interest in the context of uptake normalization for quantitative assessment of metabolic activity and/or automated image quality control.

Methods: Cerebellum, liver, and aortic arch regions were segmented with different automated approaches. Cerebella were segmented in PET volumes by means of a robust active shape model (ASM) based method. For liver segmentation, a largest possible hyperellipsoid was fitted to the liver in PET scans. The aortic arch was first segmented in CT images of a PET/CT scan by a tubular structure analysis approach, and the segmented result was then mapped to the corresponding PET scan. For each of the segmented structures, the average standardized uptake value (SUV) was calculated. To generate an independent reference standard for method validation, expert image analysts were asked to segment several cross sections of each of the three structures in 134 F-18 fluorodeoxyglucose (FDG) PET/CT scans. For each case, the true average SUV was estimated by utilizing statistical models and served as the independent reference standard.

Results: For automated aorta and liver SUV measurements, no statistically significant scale or shift differences were observed between automated results and the independent standard. In the case of the cerebellum, the scale and shift were not significantly different, if measured in the same cross sections that were utilized for generating the reference. In contrast, automated results were scaled 5% lower on average although not shifted, if FDG uptake was calculated from the whole segmented cerebellum volume. The estimated reduction in total SUV measurement error ranged between 54.7% and 99.2%, and the reduction was found to be statistically significant for cerebellum and aortic arch.

Conclusions: With the proposed methods, the authors have demonstrated that automated SUV uptake measurements in cerebellum, liver, and aortic arch agree with expert-defined independent standards. The proposed methods were found to be accurate and showed less intra- and interobserver variability, compared to manual analysis. The approach provides an alternative to manual uptake quantification, which is time-consuming. Such an approach will be important for application of quantitative PET imaging to large scale clinical trials.


Figures

Figure 1
Figure 1
Segmented brain (yellow) and regions of interest for identification of (a) liver center (green), (b) cerebellum hemisphere centers (red), and (c) aortic arch (blue). Distance measures for the ROIs are in centimeters. All PET images are shown with inverted gray-scales.
Figure 2
Figure 2
Visualization of the shape variation of the cerebellum learned from training datasets. The first mode of variation (σ = −2 to σ = +2) is shown with the mean shape (σ = 0) located in the center.
Figure 3
Figure 3
Axial (a), coronal (b), and sagittal (c) image slices of an FDG PET scan showing the brain with the segmented cerebellum. All PET images are shown with inverted gray-scales.
Figure 4
Figure 4
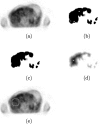
Processing steps of the 3D liver reference region identification approach depicted on a single axial PET image. (a) PET image slice showing the liver. (b) Thresholding. (c) Hole closing. (d) Distance transformation with maximum distance point marked. (e) 2D contour of the maximal hyperellipsoid with 1 cm distance to liver boundary. Note that all PET images are shown with inverted gray-scales.
Figure 5
Figure 5
Processing steps for the aortic arch reference region segmentation. (a) Volume rendering of the subregion in the CT dataset. (b) Identified tubular structures with trachea and main bronchi candidates (blue) and aortic arch candidates (red). (c) Identified trachea and main bronchi with carina and detected aortic arch. (d) Sagittal image slice with identified aortic arch.
Figure 6
Figure 6
Results of automatically identified reference measurement regions. Coronal (top row) and sagittal (bottom row) maximum intensity projections of PET scans with overlaid outlines of projected cerebellum, aortic arch, and liver regions. All PET scans are depicted as inverted maximum intensity projections using a gray-value range of 0–6 SUV. Note that in the majority of cases, only parts of the brain are imaged, which does not affect the ability of our method to locate all three structures. In the example shown in (d), even parts of the cerebellum are missing.
Figure 7
Figure 7
Scatterplot of measured vs reviewer consensus-true SUV in the four measurement slices for the cerebellum.
Figure 8
Figure 8
Scatterplot of measured vs reviewer consensus-true SUV for the cerebellum.
Figure 9
Figure 9
Scatterplot of measured vs reviewer consensus-true SUV for the aorta.
Figure 10
Figure 10
Scatterplot of measured vs reviewer consensus-true SUV for the liver.
Figure 11
Figure 11
3D rendering of reference regions utilized for liver FDG PET uptake measurement comparison in Fig. 12. (PET) Coronal and sagittal images representing a volumetric PET scan in the liver region. (L) Volumetric liver segmentation. (L*) Same as L, but the volume was eroded by a 1 cm margin. (A) Proposed automated method. (E1) Combination of axial, coronal, and sagittal liver slices segmented by reviewer 1. (E2) Combination of axial, coronal, and sagittal liver slices segmented by reviewer 2. (E1ax) Single axial liver slice segmented by reviewer 1. (E2ax) Single axial liver slice segmented by reviewer 2. (C1) Cylindrical liver region over five slices in axial direction. (C2) Circular region located in the middle of C1. (C3) Circular region located at the bottom of C1. (C4) Circular region located at the top of C1.
Figure 12
Figure 12
Example of SUV variation in dependence of the reference regions depicted in Fig. 11. Bars and lines represent the mean and standard deviation of SUVs in the segmented region, respectively.
Figure 13
Figure 13
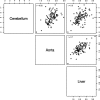
Pairwise correlation between automated volumetric SUV measurements.
Figure 14
Figure 14
Examples of segmentation results produced with our algorithm on PET/CT scan with an imaging protocol requiring arms up.

References

    1. Graham M. M., Peterson L. M., and Hayward R. M., “Comparison of simplified quantitative analyses of FDG uptake,” Nucl. Med. Biol. 27(7), 647–655 (2000).10.1016/S0969-8051(00)00143-8 - DOI - PubMed
    1. Obrzut S., Pham R. H., Vera D. R., and Hoha C. K., “Comparison of lesion-to-cerebellum uptake ratios and standardized uptake values in the evaluation of lung nodules with 18f-FDG PET,” Nucl. Med. Commun. 28(1), 7–13 (2007).10.1097/MNM.0b013e328013dce7 - DOI - PubMed
    1. Blake M. A., Slattery J. M., Halpern E. F., Fischman A. J., Mueller P. R., and Boland G. W., “Adrenal lesions: Characterization with fused pet/ct image in patients with proved or suspected malignancy-initial experience,” Radiology 238(3), 970–977 (2006).10.1148/radiol.2383042164 - DOI - PubMed
    1. Li C., Wang X., Xia Y., Eberl S., Yin Y., and Feng D. D., “Automated PET-guided liver segmentation from low-contrast CT volumes using probabilistic atlas,” Comput. Methods Programs Biomed. 3565–3568 (2011). - PubMed
    1. Heimann T., van Ginneken B., Styner M., Arzhaeva Y., Aurich V., Bauer C., Beck A., Becker C., Beichel R., Bekes G., Bello F., Binnig G., Bischof H., Bornik A., Cashman P., Chi Y., Cordova A., Dawant B., Fidrich M., Furst J., Furukawa D., Grenacher L., Hornegger J., Kainmuller D., Kitney R., Kobatake H., Lamecker H., Lange T., Lee J., Lennon B., Li R., Li S., Meinzer H. P., Nemeth G., Raicu D., Rau A. M., van Rikxoort E., Rousson M., Rusko L., Saddi K., Schmidt G., Seghers D., Shimizu A., Slagmolen P., Sorantin E., Soza G., Susomboon R., Waite J., Wimmer A., and Wolf I., “Comparison and evaluation of methods for liver segmentation from CT datasets,” IEEE Trans. Med. Imaging 28(8), 1251–1265 (2009).10.1109/TMI.2009.2013851 - DOI - PubMed

Publication types

Substances