

Organ doses, effective doses, and risk indices in adult CT: comparison of four types of reference phantoms across different examination protocols
- PMID: 22755721
- PMCID: PMC3371079
- DOI: 10.1118/1.4718710
Organ doses, effective doses, and risk indices in adult CT: comparison of four types of reference phantoms across different examination protocols
Abstract
Purpose: Radiation exposure from computed tomography (CT) to the public has increased the concern among radiation protection professionals. Being able to accurately assess the radiation dose patients receive during CT procedures is a crucial step in the management of CT dose. Currently, various computational anthropomorphic phantoms are used to assess radiation dose by different research groups. It is desirable to better understand how the dose results are affected by different choices of phantoms. In this study, the authors assessed the uncertainties in CT dose and risk estimation associated with different types of computational phantoms for a selected group of representative CT protocols.
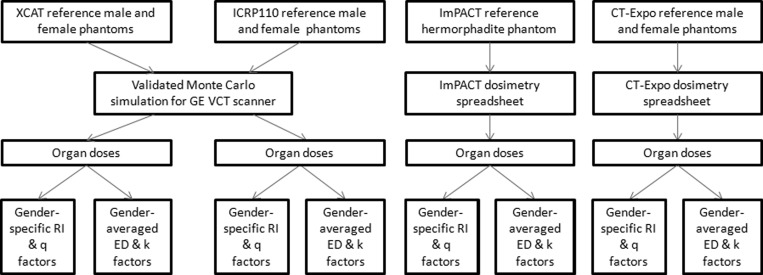
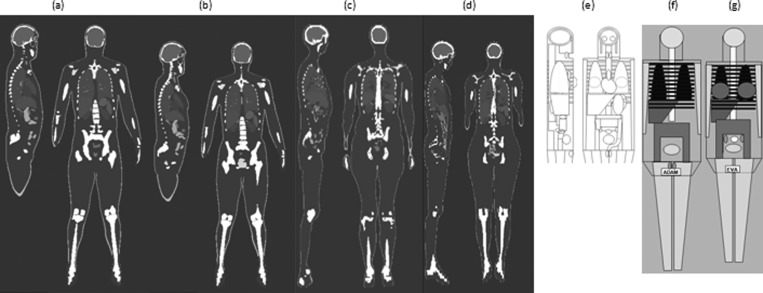
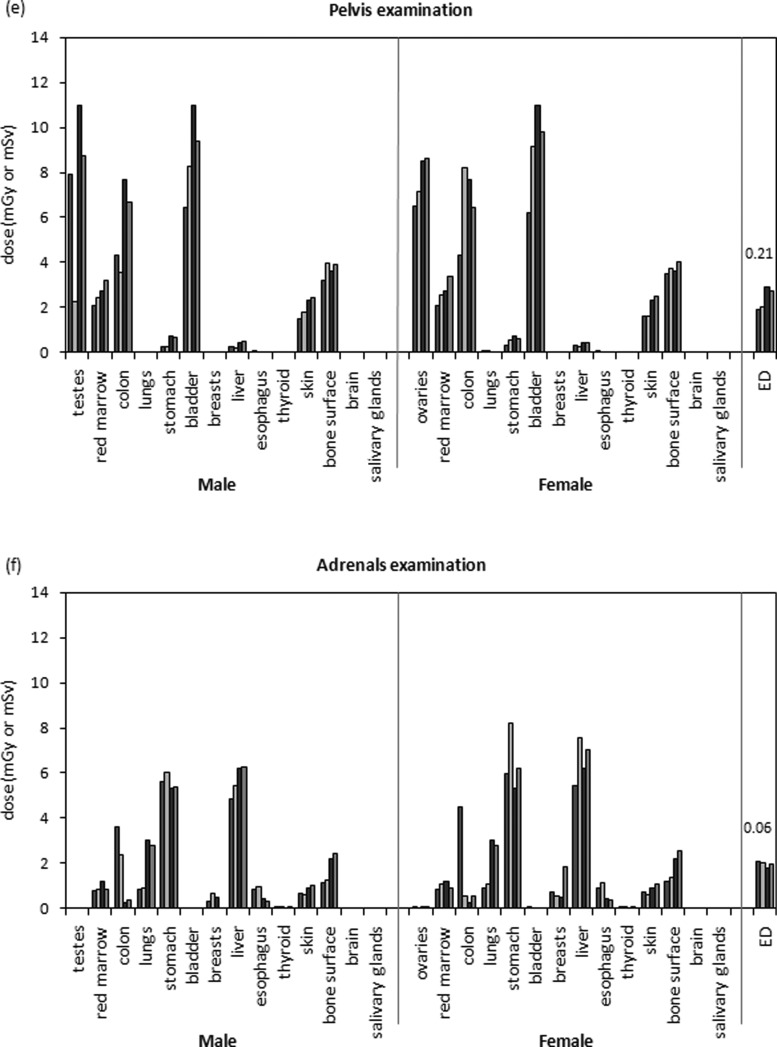
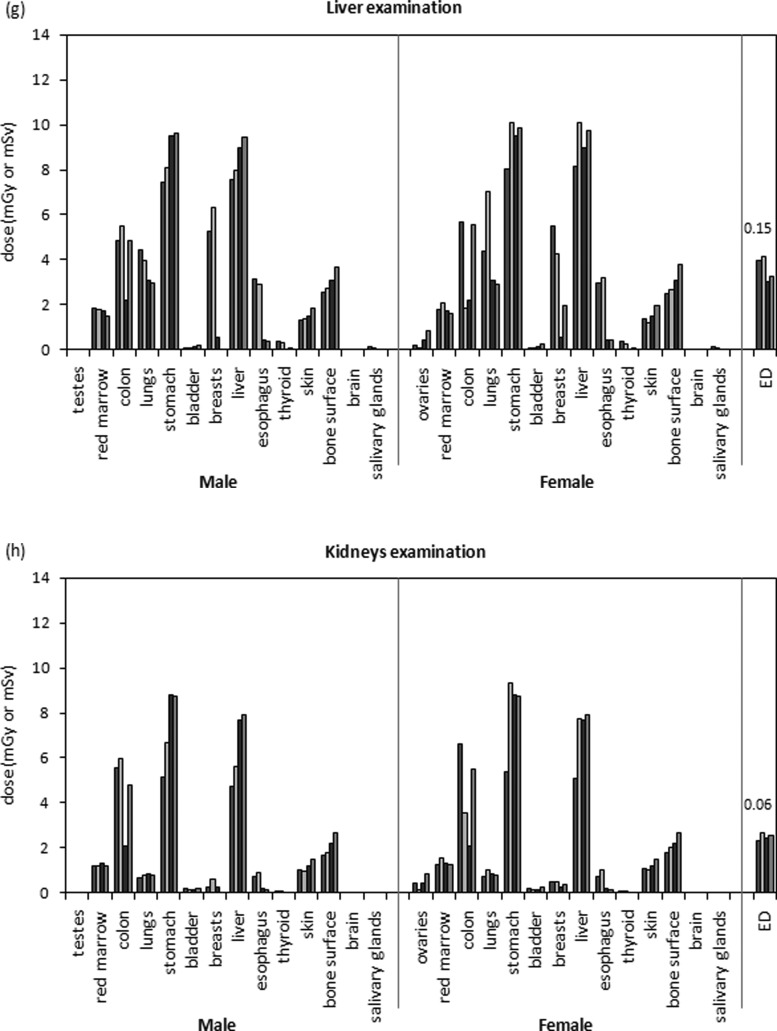
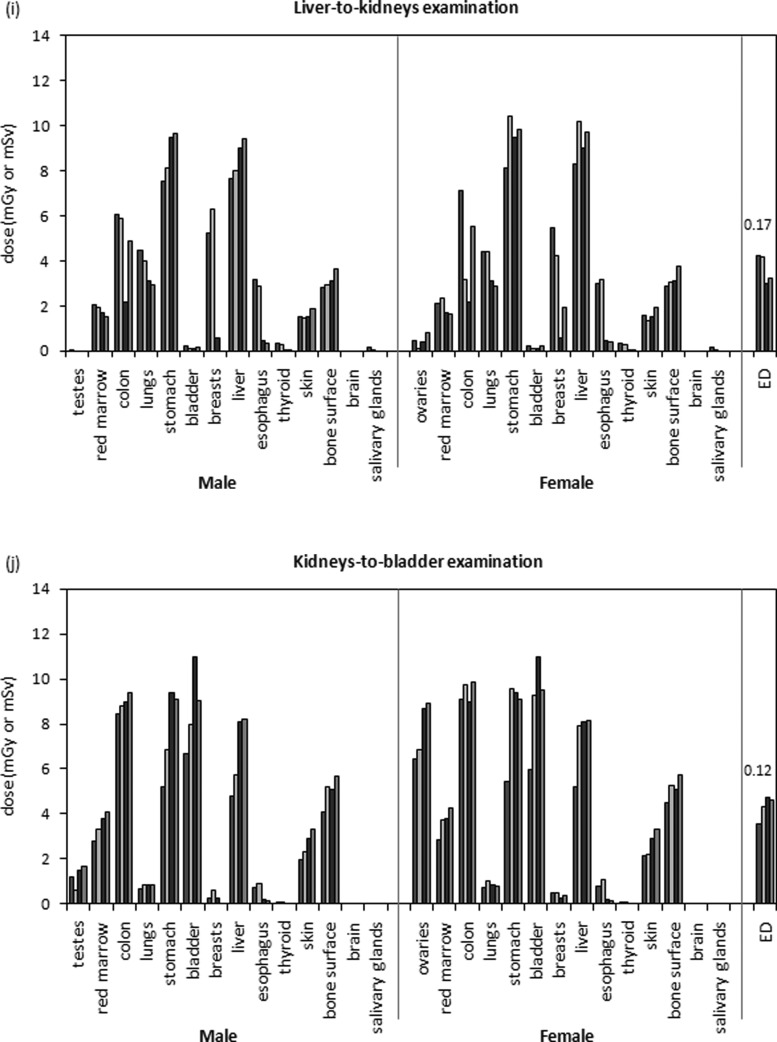
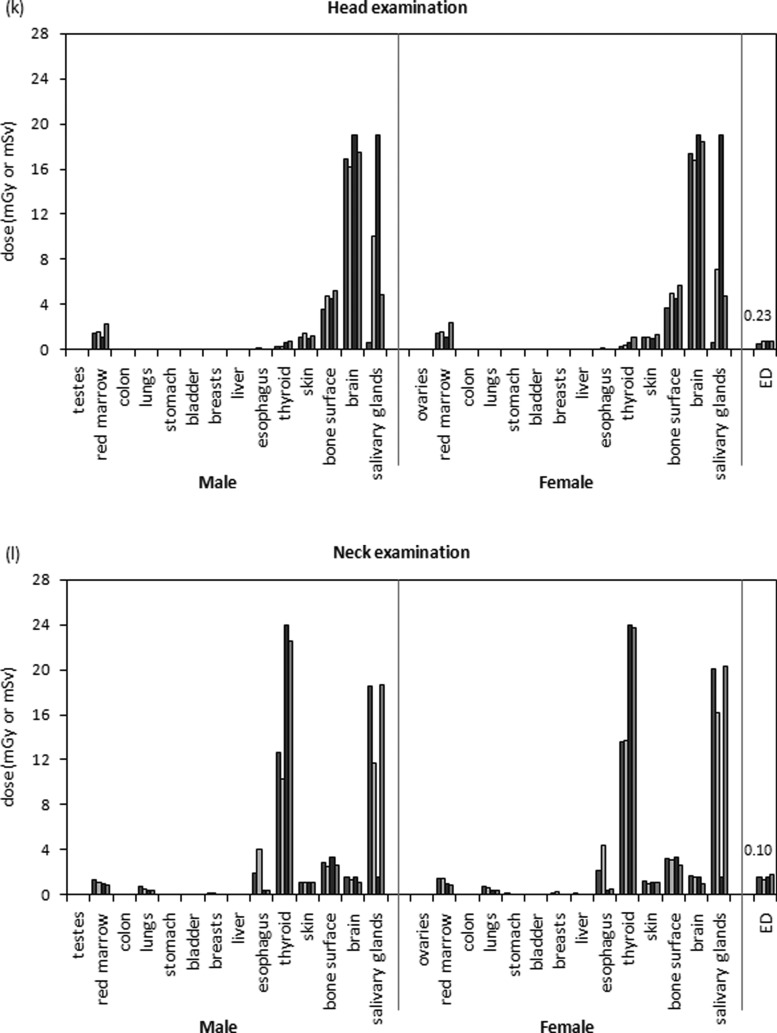
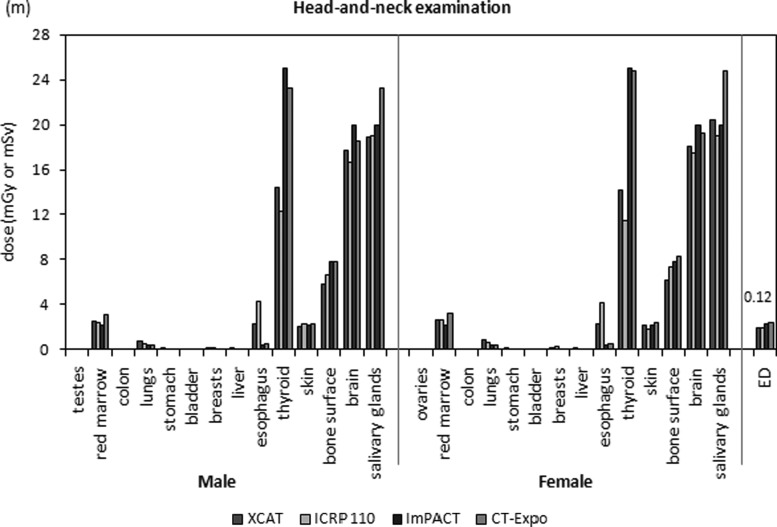
Methods: Routinely used CT examinations were categorized into ten body and three neurological examination categories. Organ doses, effective doses, risk indices, and conversion coefficients to effective dose and risk index (k and q factors, respectively) were estimated for these examinations for a clinical CT system (LightSpeed VCT, GE Healthcare). Four methods were used, each employing a different type of reference phantoms. The first and second methods employed a Monte Carlo program previously developed and validated in our laboratory. In the first method, the reference male and female extended cardiac-torso (XCAT) phantoms were used, which were initially created from the Visible Human data and later adjusted to match organ masses defined in ICRP publication 89. In the second method, the reference male and female phantoms described in ICRP publication 110 were used, which were initially developed from tomographic data of two patients and later modified to match ICRP 89 organ masses. The third method employed a commercial dosimetry spreadsheet (ImPACT group, London, England) with its own hermaphrodite stylized phantom. In the fourth method, another widely used dosimetry spreadsheet (CT-Expo, Medizinische Hochschule, Hannover, Germany) was employed together with its associated male and female stylized phantoms.
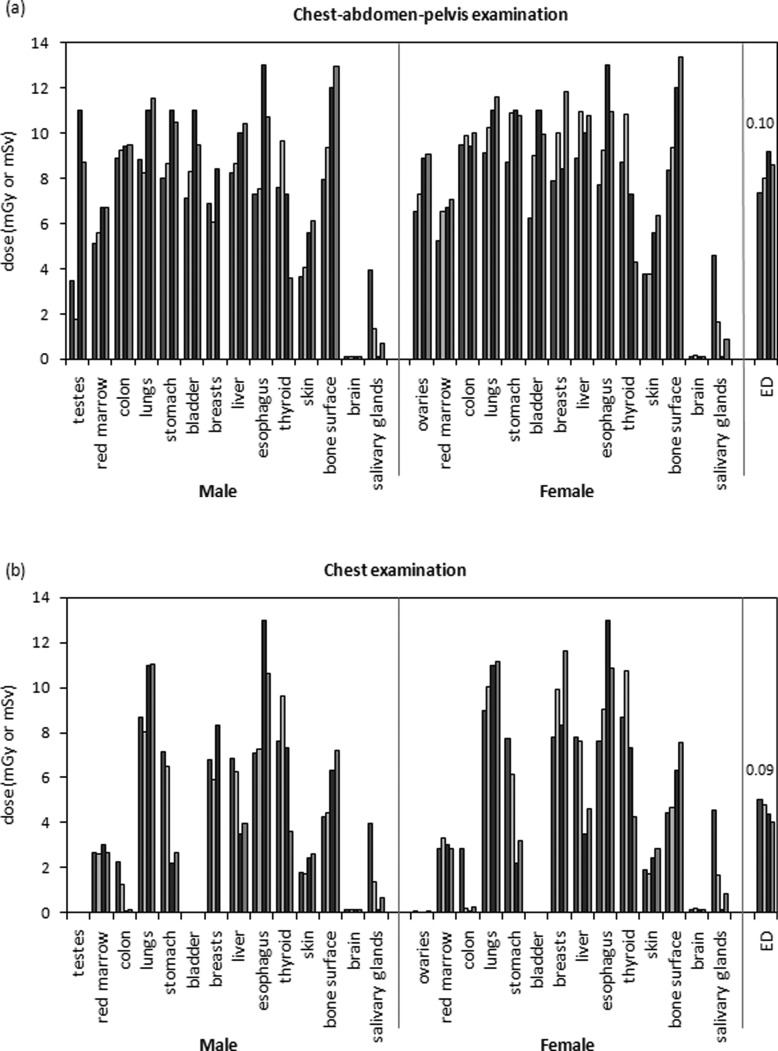
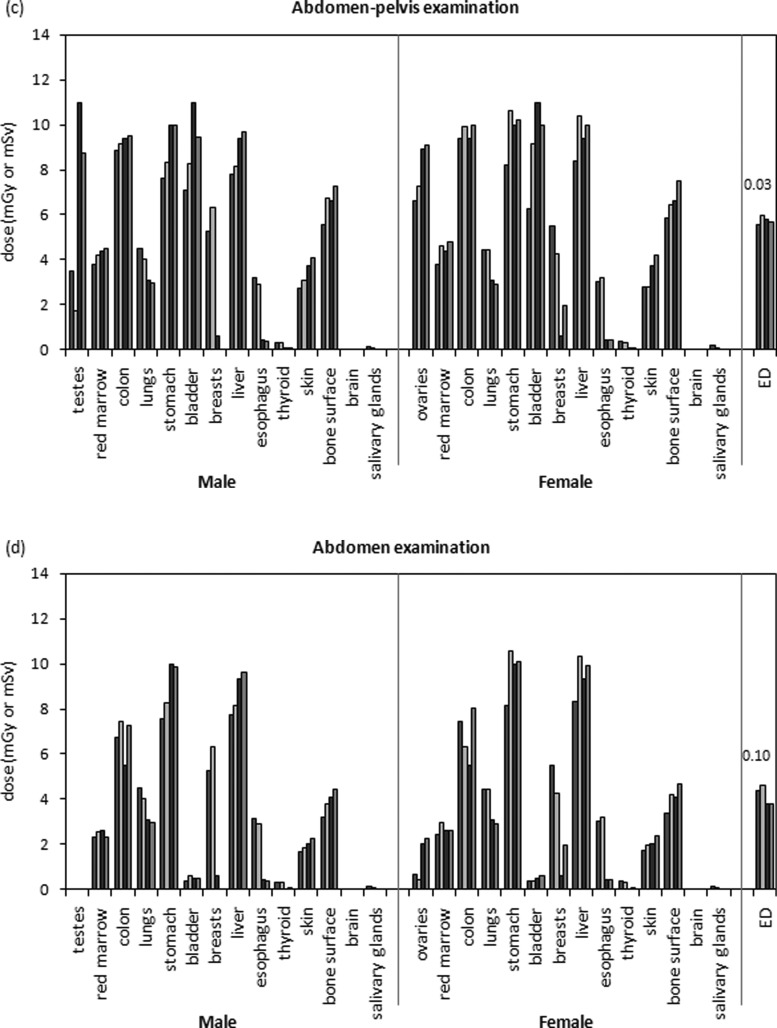
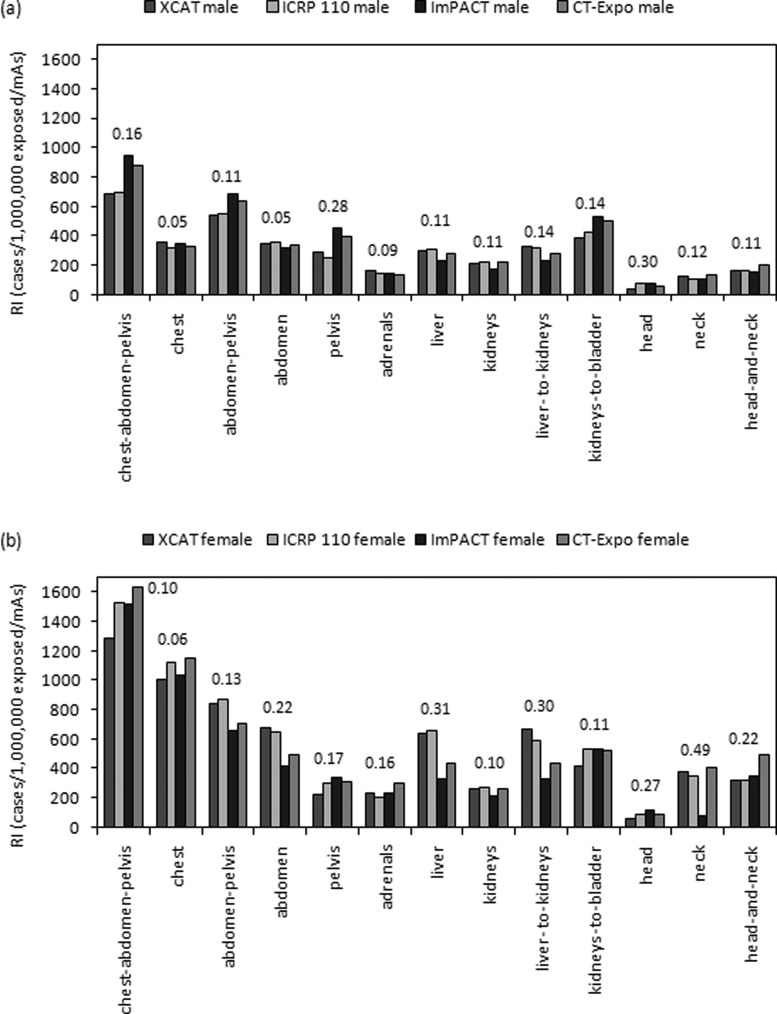
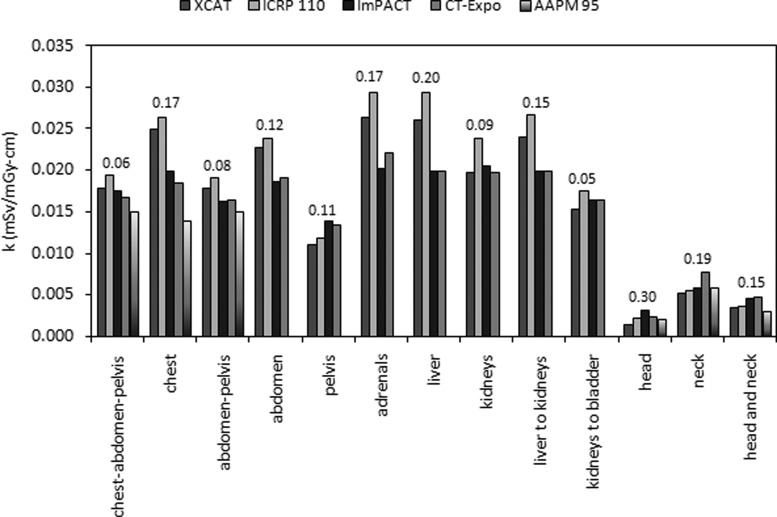
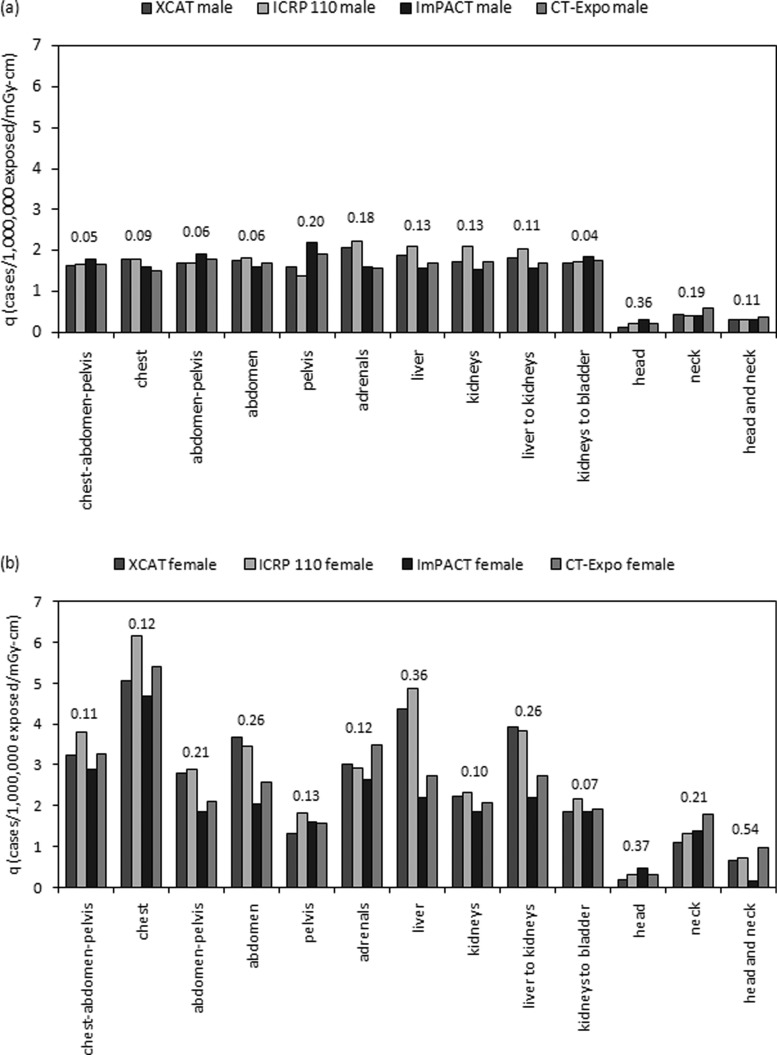
Results: For fully irradiated organs, average coefficients of variation (COV) ranged from 0.07 to 0.22 across the four male phantoms and from 0.06 to 0.18 across the four female phantoms; for partially irradiated organs, average COV ranged from 0.13 to 0.30 across the four male phantoms and from 0.15 to 0.30 across the four female phantoms. Doses to the testes, breasts, and esophagus showed large variations between phantoms. COV for gender-averaged effective dose and k factor ranged from 0.03 to 0.23 and from 0.06 to 0.30, respectively. COV for male risk index and q factor ranged from 0.06 to 0.30 and from 0.05 to 0.36, respectively; COV for female risk index and q factor ranged from 0.06 to 0.49 and from 0.07 to 0.54, respectively.
Conclusions: Despite closely matched organ mass, total body weight, and height, large differences in organ dose exist due to variation in organ location, spatial distribution, and dose approximation method. Dose differences for fully irradiated radiosensitive organs were much smaller than those for partially irradiated organs. Weighted dosimetry quantities including effective dose, male risk indices, k factors, and male q factors agreed well across phantoms. The female risk indices and q factors varied considerably across phantoms.
© 2012 American Association of Physicists in Medicine.
Figures
Similar articles
-
Effects of protocol and obesity on dose conversion factors in adult body CT.Med Phys. 2012 Nov;39(11):6550-71. doi: 10.1118/1.4754584. Med Phys. 2012. PMID: 23127050 Free PMC article.
-
Patient-specific radiation dose and cancer risk estimation in CT: part II. Application to patients.Med Phys. 2011 Jan;38(1):408-19. doi: 10.1118/1.3515864. Med Phys. 2011. PMID: 21361209 Free PMC article.
-
Comparison of patient specific dose metrics between chest radiography, tomosynthesis, and CT for adult patients of wide ranging body habitus.Med Phys. 2014 Feb;41(2):023901. doi: 10.1118/1.4859315. Med Phys. 2014. PMID: 24506654 Free PMC article.
-
Comparison of organ dosimetry methods and effective dose calculation methods for paediatric CT.Australas Phys Eng Sci Med. 2012 Jun;35(2):117-34. doi: 10.1007/s13246-012-0134-4. Epub 2012 Apr 11. Australas Phys Eng Sci Med. 2012. PMID: 22492218 Review.
-
An exponential growth of computational phantom research in radiation protection, imaging, and radiotherapy: a review of the fifty-year history.Phys Med Biol. 2014 Sep 21;59(18):R233-302. doi: 10.1088/0031-9155/59/18/R233. Epub 2014 Aug 21. Phys Med Biol. 2014. PMID: 25144730 Free PMC article. Review.
Cited by
-
In vitro dose measurements in a human cadaver with abdomen/pelvis CT scans.Med Phys. 2014 Sep;41(9):091911. doi: 10.1118/1.4893499. Med Phys. 2014. PMID: 25186398 Free PMC article.
-
Evaluation of organ doses and effective dose according to the ICRP Publication 110 reference male/female phantom and the modified ImPACT CT patient dosimetry.J Appl Clin Med Phys. 2014 Sep 7;15(5):4823. doi: 10.1120/jacmp.v15i5.4823. J Appl Clin Med Phys. 2014. PMID: 25207566 Free PMC article.
-
Virtual clinical trials in medical imaging: a review.J Med Imaging (Bellingham). 2020 Jul;7(4):042805. doi: 10.1117/1.JMI.7.4.042805. Epub 2020 Apr 11. J Med Imaging (Bellingham). 2020. PMID: 32313817 Free PMC article. Review.
-
Patient organ and effective dose estimation in CT: comparison of four software applications.Eur Radiol Exp. 2020 Feb 14;4(1):14. doi: 10.1186/s41747-019-0130-5. Eur Radiol Exp. 2020. PMID: 32060664 Free PMC article.
-
Organ Dose and Attributable Cancer Risk in Lung Cancer Screening with Low-Dose Computed Tomography.PLoS One. 2016 May 20;11(5):e0155722. doi: 10.1371/journal.pone.0155722. eCollection 2016. PLoS One. 2016. PMID: 27203720 Free PMC article.
References
-
- National Council on Radiation Protection and Measurements. and National Council on Radiation Protection and Measurements. Scientific Committee 6-2 on Radiation Exposure of the U.S. Population, Ionizing radiation exposure of the population of the United States: Recommendations of the National Council on Radiation Protection and Measurements (National Council on Radiation Protection and Measurements, Bethesda, MD, 2009).
-
- ICRP, “Radiation protection in medicine. ICRP Publication 105,” Ann. ICRP 37, 1–63 (2007). - PubMed
-
- E. S.Amis, Jr., Butler P. F., Applegate K. E., Birnbaum S. B., Brateman L. F., Hevezi J. M., Mettler F. A., Morin R. L., Pentecost M. J., Smith G. G., Strauss K. J., and Zeman R. K., “American College of Radiology white paper on radiation dose in medicine,” J. Am. Coll. Radiol. 4, 272–284 (2007).10.1016/j.jacr.2007.03.002 - DOI - PubMed
