. 2012 Jul;66(7):2015-29.
doi: 10.1111/j.1558-5646.2012.01595.x. Epub 2012 Mar 19.

Multiscale model of CRISPR-induced coevolutionary dynamics: diversification at the interface of Lamarck and Darwin

Affiliations
Free PMC article

Multiscale model of CRISPR-induced coevolutionary dynamics: diversification at the interface of Lamarck and Darwin

Lauren M Childs et al. Evolution. 2012 Jul.
Free PMC article

Abstract

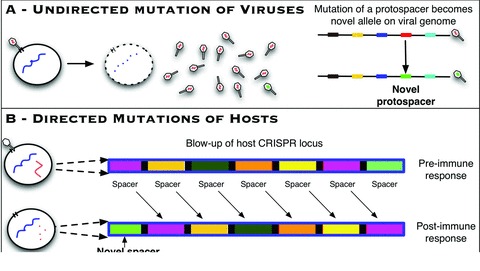
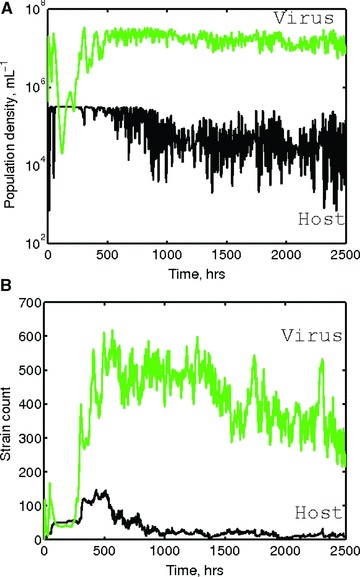
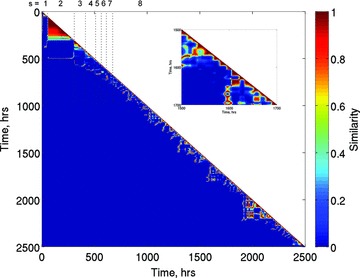
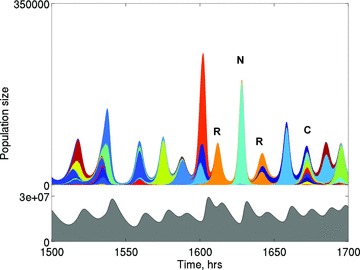
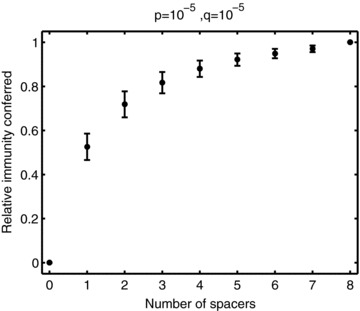
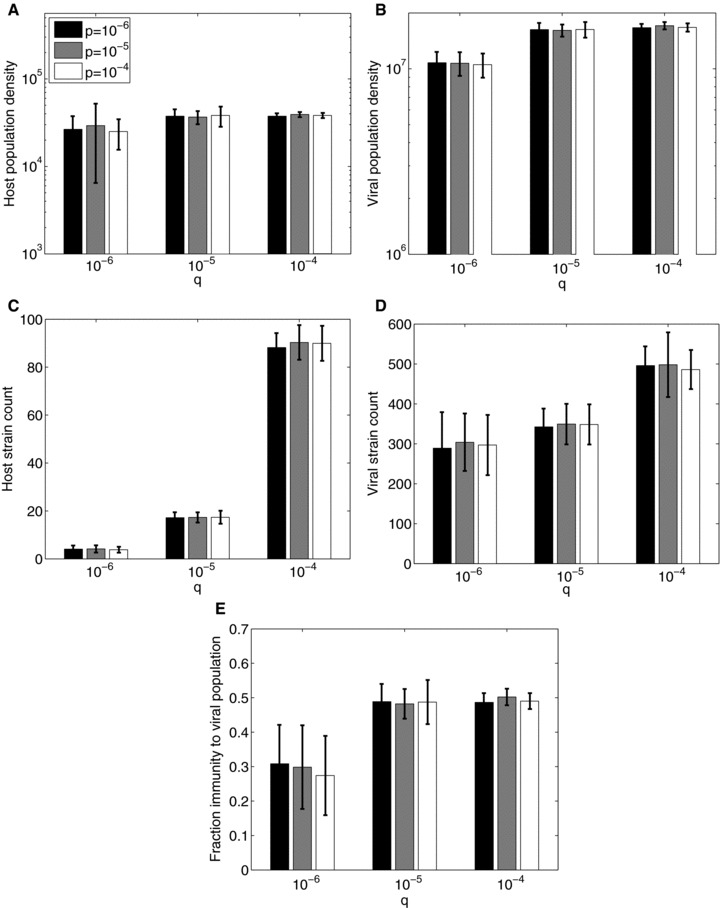
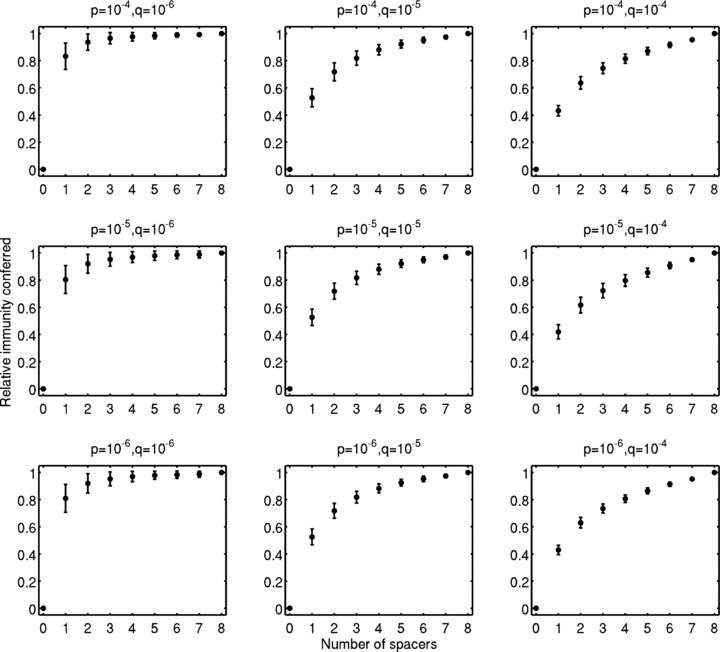
The CRISPR (Clustered Regularly Interspaced Short Palindromic Repeats) system is a recently discovered type of adaptive immune defense in bacteria and archaea that functions via directed incorporation of viral and plasmid DNA into host genomes. Here, we introduce a multiscale model of dynamic coevolution between hosts and viruses in an ecological context that incorporates CRISPR immunity principles. We analyze the model to test whether and how CRISPR immunity induces host and viral diversification and the maintenance of many coexisting strains. We show that hosts and viruses coevolve to form highly diverse communities. We observe the punctuated replacement of existent strains, such that populations have very low similarity compared over the long term. However, in the short term, we observe evolutionary dynamics consistent with both incomplete selective sweeps of novel strains (as single strains and coalitions) and the recurrence of previously rare strains. Coalitions of multiple dominant host strains are predicted to arise because host strains can have nearly identical immune phenotypes mediated by CRISPR defense albeit with different genotypes. We close by discussing how our explicit eco-evolutionary model of CRISPR immunity can help guide efforts to understand the drivers of diversity seen in microbial communities where CRISPR systems are active.


Figures

Figure 1
Figure 1
Schematic of the Darwinian and Lamarckian components of evolution in the CRISPR model. (A) Undirected mutation of viruses following successful infection leads to replacement with a novel protospacer within the viral genomes. New protospacers can occur anywhere in the protospacer set. (B) Directed mutation of hosts leads to inclusion of a novel spacer within the host genome. New spacers are added at the leading end. Note: We simplify the dynamics of spacer state change by assuming the maximum number of spacers per strain type is constant. When the maximum number is reached, the addition of a spacer at the leading end is accompanied by deletion of a spacer at the trailing end.
Figure 2
Figure 2
Dynamics and diversification of multiple spacer–protospacer model (eight spacers, 10 protospacers). (A) Viral population dynamics (green online) and host population dynamics (black) show that population densities undergo fluctuations. (B) Viral strain count (green online) and host strain count (black) show the diversification into multiple host and viral strains. These graphs show results from a single representative simulation (out of 100 replicates).
Figure 3
Figure 3
Incorporation of spacers causes changes in host population size and host population content. Ecological similarity between the whole host population at two time points using the Morisita–Horn index which takes into account both abundance and type (see eqs. 4–5). Time intervals of 2 h are used. The color bar indicates similarity from blue (low similarity) to red (high similarity). The diagonal is the comparison of one community against itself and hence has perfect similarity (dark red). Communities significantly separated in time are blue indicating no similarity (see bottom left of the figure). The vertical bars indicate an increase in the average number of spacers per host. The average number of spacers, s is marked above the graph and saturates at a maximum of s= 8. The inset is an enlarged version of t= 1500 to t= 1700. This graph shows results from a single representative simulation (out of 100 replicates).
Figure 4
Figure 4
Proportion of host strains in the population. Host strains (independent colors—colors repeat when not directly touching) are born into the population and increase in size over time. The total height of the colored area is proportional to the population size and the vertical height of each color within the colored area is proportional to the percent of the population comprised by each strain. Strains first appear in the middle of the color that is their parent strain. Some novel strains (i.e., light blue at t≍ 1625 denoted by N) rapidly become the dominant strain. At times, multiple hosts emerge as coalitions and comprise significant portions of the population (i.e., at t≍ 1675 denoted by C). Finally, recurrence of strains can be observed (orange peaks at t≍ 1610 and t≍ 1640 correspond to the same strain denoted by R). Only host strains comprising at least 1% of the population are included. The total viral population density is shown in the lower panel. This graph shows results from a single representative simulation (out of 100 replicates).
Figure 5
Figure 5
Most recently acquired spacers provide greatest immunity. Relative immunity conferred by the newest n spacers in the locus compared to the immunity from the full locus of eight spacers. Mean (circles) and standard deviation (error bars) were computed for 100 replicates averaged over the time points after the locus is filled with spacers. Immunity is determined by calculating what percentage of the viruses the most recent n spacers from all hosts can match, where n= 1, 2, …, 8. Relative immunity is the percentage of viruses that the most recent n spacers from all hosts can match compared to the percentage of viruses the full spacer locus (in our case eight spacers) matches. The majority of the immunity is provided by the first spacer and more than 80% immunity is provided by the first three spacers.
Figure 6
Figure 6
Population dynamics are more influenced by changes in the host spacer acquisition rate (q) than stochastic failure of CRISPR immunity (p). Stochastic failure of the CRISPR system when the host is immune, p, and host spacer acquisition rate, q, are varied from 10−6 to 10−4. Values of q are grouped on the x-axis. Values of p have identically colored bars (black represents p= 10−6; gray represents p= 10−5; white represents p= 10−4.) For all values of p, bars for q= 10−4 represent the median of 25 replicates, bars for q= 10−5 represent the median of 75 replicates, and bars for q= 10−6 represent the median of 100 replicates. Lines represent standard error. As q increases, host population density (A) is unchanged, viral population density (B) increases, host strain counts (C) increase, viral strain counts (D) increase, and the fraction of the viral population the hosts are immune to (E) increases.
Figure 7
Figure 7
CRISPR Immunity is more influenced by changes in the host spacer acquisition rate (q) than stochastic failure of CRISPR immunity (p). Relative immunity conferred by the newest n spacers in the locus is compared to the immunity from the full locus of 8 spacers. Mean (circles) and standard deviation (error bars) were computed for all replicates averaged over the time points after the locus is filled with spacers. Immunity is determined by calculating what percentage of the viruses the most recent n spacers from all hosts can match, where n= 1, 2, …, 8. Relative immunity is the percentage of viruses the most recent n spacers from all hosts can match compared to the percentage of viruses the full spacer locus (in our case 8 spacers) matches. Values of p and q vary from 10−6 to 10−4. For all values of p, graphs for q= 10−4 include 25 replicates, graphs for q= 10−5 include 75 replicates, and graphs for q= 10−6 include 100 replicates.

References

    1. Agrawal A, Lively C. Infection genetics: gene-for-gene versus matching-alleles models and all points in between. Evol. Ecol. Res. 2002;4:79–90.
    1. Andersson AF, Banfield JF. Virus population dynamics and acquired virus resistance in natural microbial communities. Science. 2008;320:1047–1050. - PubMed
    1. Barrangou R, Fremaux C, Deveau H, Richards M, Boyaval P, Moineau S, Romero DA, Horvath P. CRISPR provides acquired resistance against viruses in prokaryotes. Science. 2007;315:1709–1712. - PubMed
    1. Bland C, Ramsey TL, Sabree F, Lowe M, Brown K, Kyrpides NC, Hugenholtz P. CRISPR Recognition Tool (CRT): a tool for automatic detection of clustered regularly interspaced palindromic repeats. BMC Bioinform. 2007;8:209. - PMC - PubMed
    1. Bolotin A, Ouinquis B, Sorokin A, Ehrlich S. Clustered regularly interspaced short palindrome repeats (CRISPRs) have spacers of extrachromosomal origin. Microbiol-SGM. 2005;151:2551–2561. - PubMed

Publication types