

Pathway-based classification of cancer subtypes
- PMID: 22759382
- PMCID: PMC3485163
- DOI: 10.1186/1745-6150-7-21
Pathway-based classification of cancer subtypes
Abstract
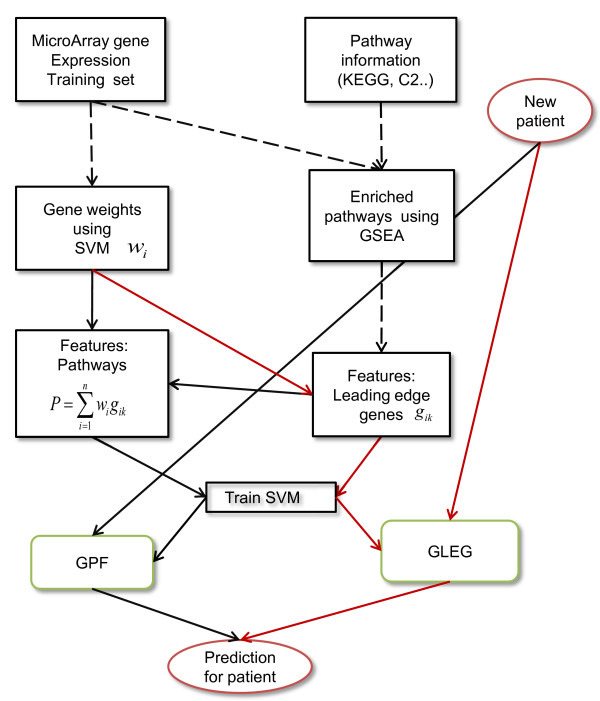
Background: Molecular markers based on gene expression profiles have been used in experimental and clinical settings to distinguish cancerous tumors in stage, grade, survival time, metastasis, and drug sensitivity. However, most significant gene markers are unstable (not reproducible) among data sets. We introduce a standardized method for representing cancer markers as 2-level hierarchical feature vectors, with a basic gene level as well as a second level of (more stable) pathway markers, for the purpose of discriminating cancer subtypes. This extends standard gene expression arrays with new pathway-level activation features obtained directly from off-the-shelf gene set enrichment algorithms such as GSEA. Such so-called pathway-based expression arrays are significantly more reproducible across datasets. Such reproducibility will be important for clinical usefulness of genomic markers, and augment currently accepted cancer classification protocols.
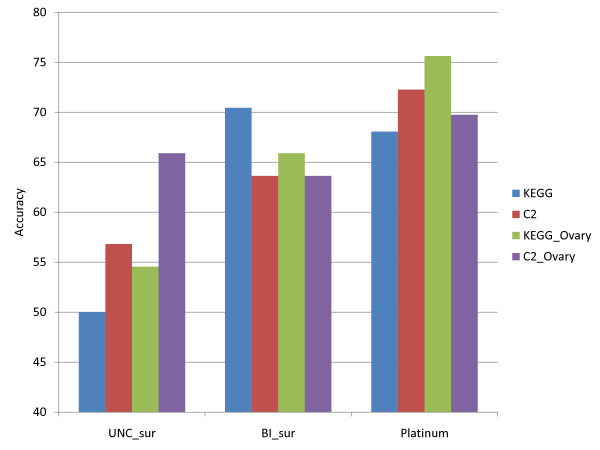
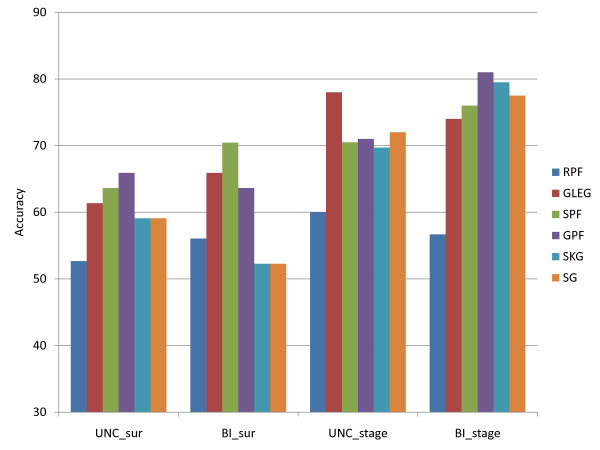
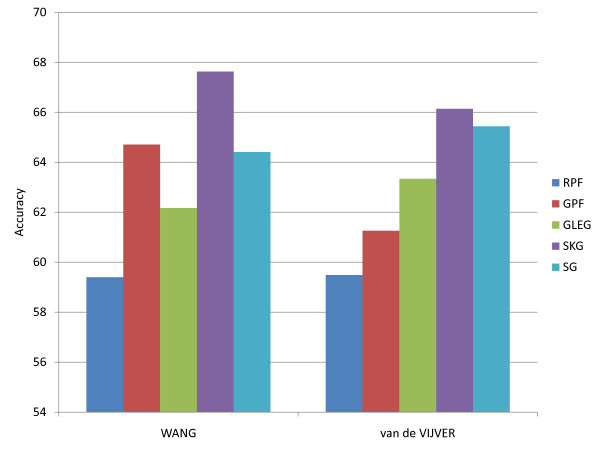
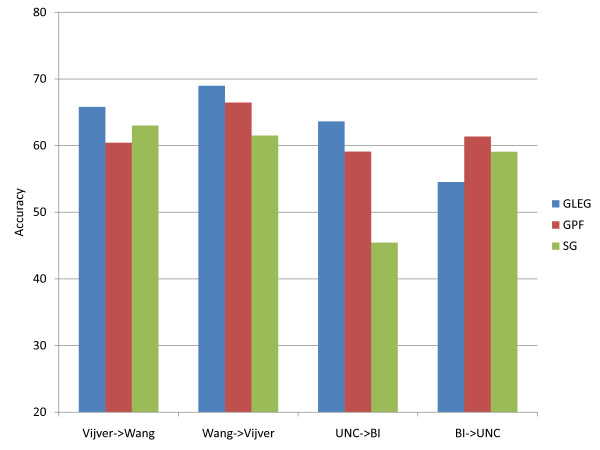
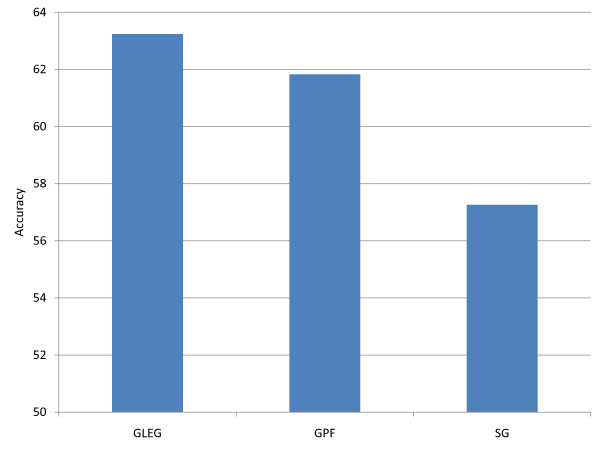
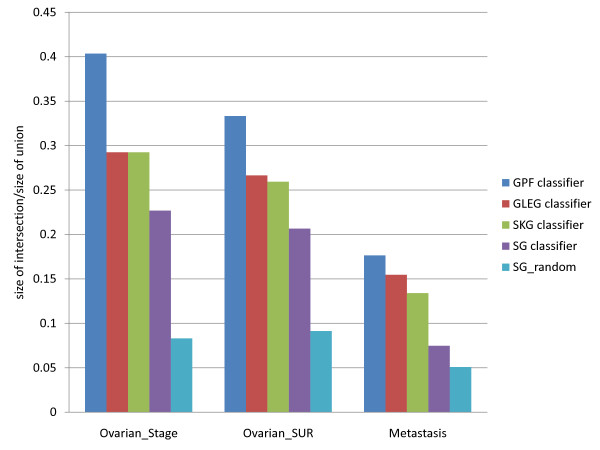
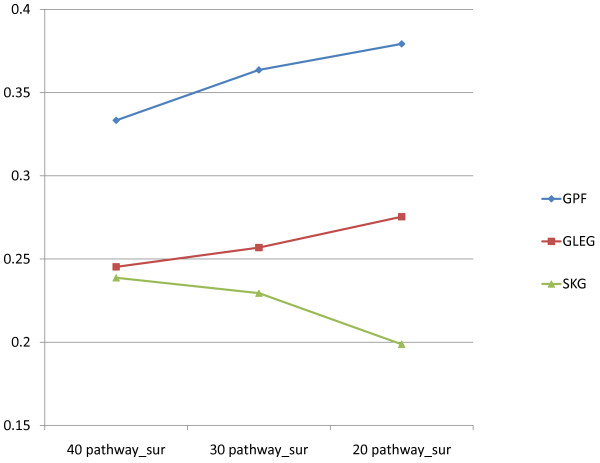
Results: The present method produced more stable (reproducible) pathway-based markers for discriminating breast cancer metastasis and ovarian cancer survival time. Between two datasets for breast cancer metastasis, the intersection of standard significant gene biomarkers totaled 7.47% of selected genes, compared to 17.65% using pathway-based markers; the corresponding percentages for ovarian cancer datasets were 20.65% and 33.33% respectively. Three pathways, consisting of Type_1_diabetes mellitus, Cytokine-cytokine_receptor_interaction and Hedgehog_signaling (all previously implicated in cancer), are enriched in both the ovarian long survival and breast non-metastasis groups. In addition, integrating pathway and gene information, we identified five (ID4, ANXA4, CXCL9, MYLK, FBXL7) and six (SQLE, E2F1, PTTG1, TSTA3, BUB1B, MAD2L1) known cancer genes significant for ovarian and breast cancer respectively.
Conclusions: Standardizing the analysis of genomic data in the process of cancer staging, classification and analysis is important as it has implications for both pre-clinical as well as clinical studies. The paradigm of diagnosis and prediction using pathway-based biomarkers as features can be an important part of the process of biomarker-based cancer analysis, and the resulting canonical (clinically reproducible) biomarkers can be important in standardizing genomic data. We expect that identification of such canonical biomarkers will improve clinical utility of high-throughput datasets for diagnostic and prognostic applications.
Figures
Similar articles
-
Stem cell-like gene expression in ovarian cancer predicts type II subtype and prognosis.PLoS One. 2013;8(3):e57799. doi: 10.1371/journal.pone.0057799. Epub 2013 Mar 11. PLoS One. 2013. PMID: 23536770 Free PMC article.
-
Identification of metastasis and prognosis-associated genes for serous ovarian cancer.Biosci Rep. 2020 Jun 26;40(6):BSR20194324. doi: 10.1042/BSR20194324. Biosci Rep. 2020. PMID: 32510146 Free PMC article.
-
A genomic and transcriptomic approach for a differential diagnosis between primary and secondary ovarian carcinomas in patients with a previous history of breast cancer.BMC Cancer. 2010 May 21;10:222. doi: 10.1186/1471-2407-10-222. BMC Cancer. 2010. PMID: 20492709 Free PMC article.
-
MicroRNA, a Promising Biomarker for Breast and Ovarian Cancer: A Review.Curr Protein Pept Sci. 2021;22(8):599-619. doi: 10.2174/1389203722666210608154705. Curr Protein Pept Sci. 2021. PMID: 34102968 Review.
-
Molecular markers for breast cancer: prediction on tumor behavior.Dis Markers. 2014;2014:513158. doi: 10.1155/2014/513158. Epub 2014 Jan 28. Dis Markers. 2014. PMID: 24591761 Free PMC article. Review.
Cited by
-
Squalene epoxidase expression is associated with breast tumor progression and with a poor prognosis in breast cancer.Oncol Lett. 2021 Apr;21(4):259. doi: 10.3892/ol.2021.12520. Epub 2021 Feb 4. Oncol Lett. 2021. PMID: 33664822 Free PMC article.
-
Pathway-based cancer transcriptome deciphers a high-resolution intrinsic heterogeneity within bladder cancer classification.J Transl Med. 2025 Jun 17;23(1):666. doi: 10.1186/s12967-025-06682-1. J Transl Med. 2025. PMID: 40528211 Free PMC article.
-
Pathway-based outlier method reveals heterogeneous genomic structure of autism in blood transcriptome.BMC Med Genomics. 2013 Sep 24;6:34. doi: 10.1186/1755-8794-6-34. BMC Med Genomics. 2013. PMID: 24063311 Free PMC article.
-
Systems Cytogenomics: Are We Ready Yet?Curr Genomics. 2021 Feb;22(2):75-78. doi: 10.2174/1389202922666210219112419. Curr Genomics. 2021. PMID: 34220294 Free PMC article.
-
Expression and significance of squalene epoxidase in squamous lung cancerous tissues and pericarcinoma tissues.Thorac Cancer. 2014 Jul;5(4):275-80. doi: 10.1111/1759-7714.12087. Epub 2014 Jul 3. Thorac Cancer. 2014. PMID: 26767013 Free PMC article.
References
-
- Wang Y, Klijn JGM, Zhang Y, Sieuwerts AM, Look MP, Yang F, Talantov D, Timmermans M, Meijer-van Gelder ME, Yu J. Gene-expression profiles to predict distant metastasis of lymph-node-negative primary breast cancer. Lancet. 2005;365(9460):671–679. - PubMed
Publication types
MeSH terms
Substances
Grants and funding
LinkOut - more resources
Full Text Sources
Medical
Research Materials
Miscellaneous
