. 2012 Jun 25;13 Suppl 10(Suppl 10):S13.
doi: 10.1186/1471-2105-13-S10-S13.

Horizontal gene transfer dynamics and distribution of fitness effects during microbial in silico evolution

Affiliations

Horizontal gene transfer dynamics and distribution of fitness effects during microbial in silico evolution

Vadim Mozhayskiy et al. BMC Bioinformatics. .

Abstract

Background: Horizontal gene transfer (HGT) is a process that facilitates the transfer of genetic material between organisms that are not directly related, and thus can affect both the rate of evolution and emergence of traits. Recent phylogenetic studies reveal HGT events are likely ubiquitous in the Tree of Life. However, our knowledge of HGT's role in evolution and biological organization is very limited, mainly due to the lack of ancestral evolutionary signatures and the difficulty to observe complex evolutionary dynamics in a laboratory setting. Here, we utilize a multi-scale microbial evolution model to comprehensively study the effect of HGT on the evolution of complex traits and organization of gene regulatory networks.

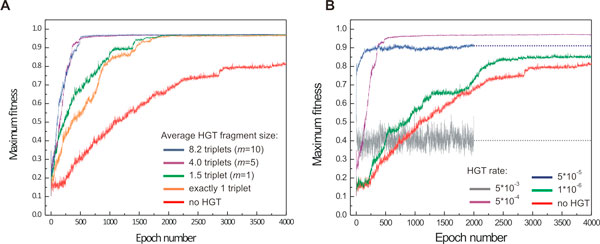
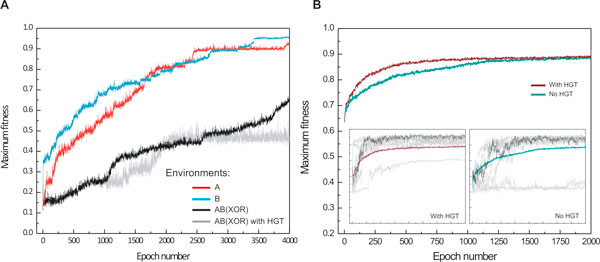
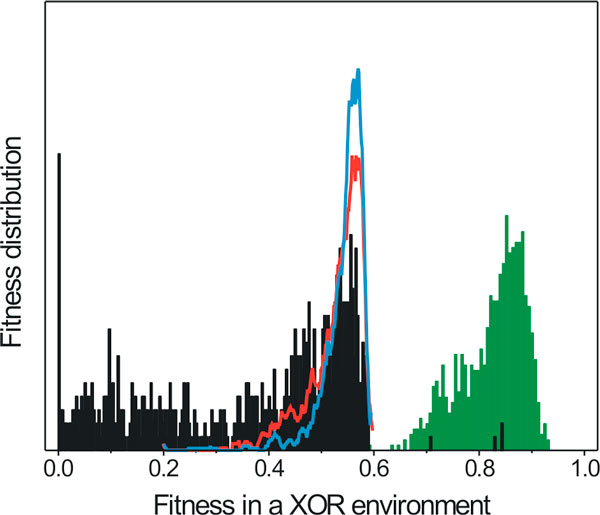
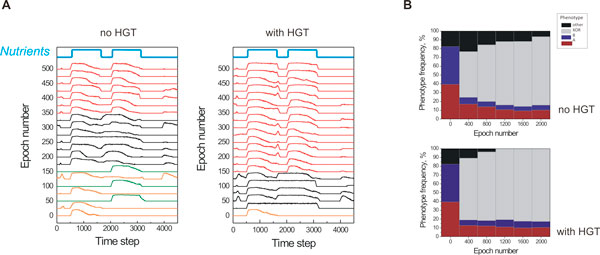
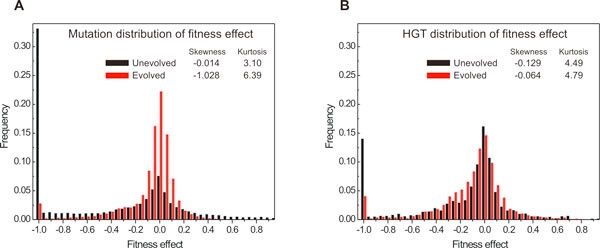
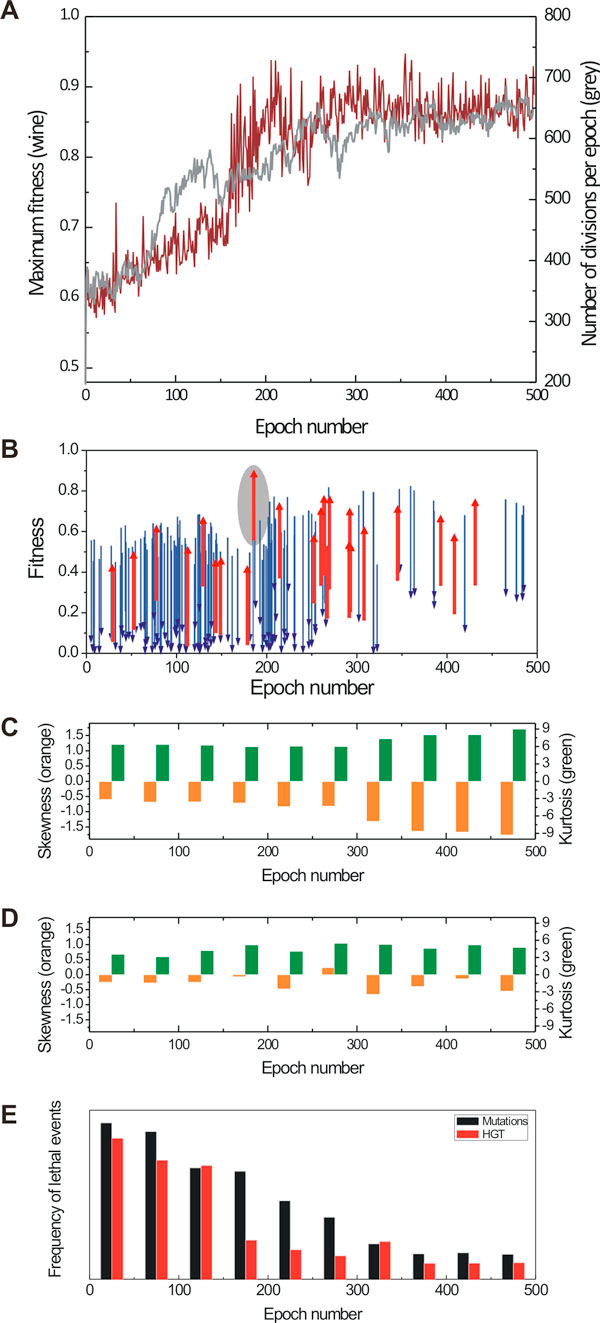
Results: Large-scale simulations reveal a distinct signature of the Distribution of Fitness Effect (DFE) for HGT events: during evolution, while mutation fitness effects become more negative and neutral, HGT events result in a balanced effect distribution. In either case, lethal events are significantly decreased during evolution (33.0% to 3.2%), a clear indication of mutational robustness. Interestingly, evolution was accelerated when populations were exposed to correlated environments of increasing complexity, especially in the presence of HGT, a phenomenon that warrants further investigation. High HGT rates were found to be disruptive, while the average transferred fragment size was linked to functional module size in the underlying biological network. Network analysis reveals that HGT results in larger regulatory networks, but with the same sparsity level as those evolved in its absence. Observed phenotypic variability and co-existing solutions were traced to individual gain/loss of function events, while subsequent re-wiring after fragment integration was necessary for complex traits to emerge.


Figures

Figure 1
Figure 1
Basic cellular modeling in our simulation framework. (A) A "triplet": capturing the processes of transcription, translation, and post-translational modification. (B) Example of a gene regulatory and biochemical network in an organism where environmental signals (e.g. oxygen, temperature, etc.) regulate the expression of certain genes/proteins. The value at each node of the graph corresponds to the number of molecules of a given molecular species. Red/blue arrows denote positive/negative regulation and their corresponding weights.
Figure 2
Figure 2
General overview of the simulated ecological setting. Microbial population evolves under a complex environment AB ("single-step" adaptation) either directly (i), or through a first step of evolution in less convoluted, but still related, environments A and B with (ii) or without (iii) the presence of HGT events.
Figure 3
Figure 3
Environmental signals and nutrient abundance. Environmental signals (green) and nutrient abundance (red, blue and grey) for the three environments (A, B, and AB (XOR) respectively) shown as a function of time steps within one epoch. Nutrient presence is a delayed function of the two signals. The same signals and nutrients are present in all environments (i.e. all cells have the same special triplet function), but with different temporal dynamics. One epoch is shown in each plot, which consists of 4,500 time units total.
Figure 4
Figure 4
Combined XOR phenotype is formed by HGT between cells evolved in single A and B environments. (A) Microarray-like expression levels with one epoch (4500 time steps) for three cells from left to right: donor cell for the HGT transfer evolved in the B environment (highlighted triplets T0, T4-T6 form a minimal network), recipient cell evolved in the A environment (triplets T0-T3 is the minimal network), and a final combined cell with a minimal network T0-T6. Shaded expression levels are for triplets outside the minimal functional network. Environmental signals and the nutrient abundance as a function of time are shown at the top in green and grey, respectively. The Pearson correlation between expression levels of the modified protein from the metabolic pathway RP0 (bottom row in metabolic pathway T0) and nutrient abundance is the fitness of the cell w. (B) Corresponding gene regulatory and biochemical networks (only minimal networks are shown). Network for cell of type A (recipient cell) is shown on the solid yellow background. Triplets transferred in HGT fragment from the cell of type B are enclosed in the dashed segment on the right. Each triplet (T1-T6, and the metabolic triplet T0 on the left) consists of three nodes from bottom to top: mRNA, protein, and modified protein. Red and blue arrows show activation and inhibition (strength of regulation is not shown). Regulation by two external signals S1 and S2 is shown with green arrows.
Figure 5
Figure 5
Effect of HGT as a function of transferred fragment size and HGT rate. (A) Emergence of fit phenotypes is accelerated with increasing average fragment length and saturates after the latter has reached the effective minimal network size; m denotes the middle-point of the fragment size probability density function (see methods), (B) evolutionary trajectories for different HGT rates, averaged over 32 simulations.
Figure 6
Figure 6
Fitness trajectories in partial A, B, and full AB (XOR) environments. (A) Evolution of random populations of cells in A, B and XOR environments shown in red, blue, and black respectively. Grey curve shows the averaged fitness trajectory for evolution in a XOR environment with the presence of HGT. Maximum fitness is averaged over 64 simulations for evolution in A and B environments, and over 32 simulations for evolution in a XOR environment. HGT rate here is at 5·10-5 and average fragment size is 4 triplets. (B) Evolutionary trajectory under "dual-step" evolution, where population of evolved cells in A and B environments show remarkably fast adaptation to environment AB (64 simulations). HGT confers an additional acceleration of adaptation to new settings. (B, inserts) Maximum fitness curves for 8 out of 64 individual simulations with (B, left insert) and without (B, left insert) HGT are shown in grey. One curve is highlighted with dark grey for clarity.
Figure 7
Figure 7
Fitness probability distribution functions in a XOR environment. Direct combination of cells evolved in A and B environments does not exhibit a combined XOR phenotype. Red and blue lines: cells evolved in A and B environments, respectively. Grey bars: cells constructed by a combination of networks from cells evolved in A and B environments. Majority of combinations have fitness equal or a lower than either of the combined fragments. Few events (4/800) result in a combined fitness higher than 0.6 (1600 cells were randomly selected from 16 populations fully evolved A and B environments, 800 random combined cells were tested for the combined fitness in a XOR environment). Green bars show the fitness distribution of 800 hundred cells collected from the same populations after adaptation to a XOR environment with a presence of HGT.
Figure 8
Figure 8
Metabolic pathway expression and relative phenotypic frequencies during evolution in the AB environment. (A) Emergence of the XOR phenotype in a mixed (A &B) population evolving in the XOR environment. Phenotypes of the fittest organisms of the population are shown for the first 500 epochs of simulation. Without HGT (left panel) cells with initial phenotypes A and B (orange and green plots, respectively) are the fittest for the first 150 epochs; afterwards cells mutate to intermediate phenotypes (black plots) and finally an XOR-like phenotype emerges (red plots). Emergence of the intermediate and final phenotype occurs sooner if networks of type A and B are combined in one organism by HGT (right panel). Time profile of nutrient abundance is shown for comparison with phenotype profiles on the top of each panel in blue. (B) Emergence of an XOR phenotype in a population composed as a 1:1 mixture of cells with A and B phenotype without (left panel) and with (right panel) HGT in 400 epoch intervals. Frequencies of A, B, and XOR phenotypes are shown in red, blue, and grey respectively; percentage of cells with no distinct phenotype is shown in black. Statistics is collected over 64 experiments.
Figure 9
Figure 9
Distribution of fitness effect (DFE) in unevolved (black) and evolved (red) populations. Effect of (A) mutation and (B) HGT events. As populations evolve, frequency of neutral mutations increases, but frequency of neutral HGT events stays almost unaffected; in both cases frequency of lethal events is decreased in the evolved populations. Skewness and kurtosis of the distributions is shown on the top; more details can be found in Table 3. For each of four plots, statistics is collected over 8 populations evolved for 100 epochs in a XOR environment.
Figure 10
Figure 10
A population composed of cells evolved in partial A and B environments evolving in a combined XOR environment. (A) maximum fitness trajectory (wine) and number of divisions per epoch (grey); additional details for this evolutional trajectory are shown in the following panels: (B) HGT events with strong positive (increase in fitness Δw > +0.3) and very strong negative (decrease in fitness Δw < -0.4) fitness effects are shown with red and blue arrows, respectively; origins and heads of arrows represent fitness before and after HGT event, respectively; red arrow highlighted with the grey oval represents the HGT event, which resulted in the emergence of a fully evolved cell in this population (this event is described in detail in Fig. 4) (C) skewness and kurtosis of DFE for non-lethal mutation events calculated for every 50 epochs; (D) same as above, DFE of non-lethal HGT events; (E) frequency of lethal (deleterious) mutation and HGT events as a function of evolutionary time.

Similar articles

Cited by

References

    1. Ragan MA, Beiko RG. Lateral genetic transfer: open issues. Philos Trans R Soc Lond B Biol Sci. 2009;364:(1527):2241–2251. - PMC - PubMed
    1. Boto L. Horizontal gene transfer in evolution: facts and challenges. Proc Biol Sci. 2010;277(1683):819–827. doi: 10.1098/rspb.2009.1679. - DOI - PMC - PubMed
    1. Koonin EV, Makarova KS, Aravind L. Horizontal gene transfer in prokaryotes: quantification and classification. Annu Rev Microbiol. 2001;55:709–742. doi: 10.1146/annurev.micro.55.1.709. - DOI - PMC - PubMed
    1. Gogarten JP, Doolittle WF, Lawrence JG. Prokaryotic evolution in light of gene transfer. Mol Biol Evol. 2002;19(12):2226–2238. doi: 10.1093/oxfordjournals.molbev.a004046. - DOI - PubMed
    1. Nakamura Y, Itoh T, Matsuda H, Gojobori T. Biased biological functions of horizontally transferred genes in prokaryotic genomes. Nat Genet. 2004;36(7):760–766. doi: 10.1038/ng1381. - DOI - PubMed

Publication types