

Efficient error correction for next-generation sequencing of viral amplicons
- PMID: 22759430
- PMCID: PMC3382444
- DOI: 10.1186/1471-2105-13-S10-S6
Efficient error correction for next-generation sequencing of viral amplicons
Abstract
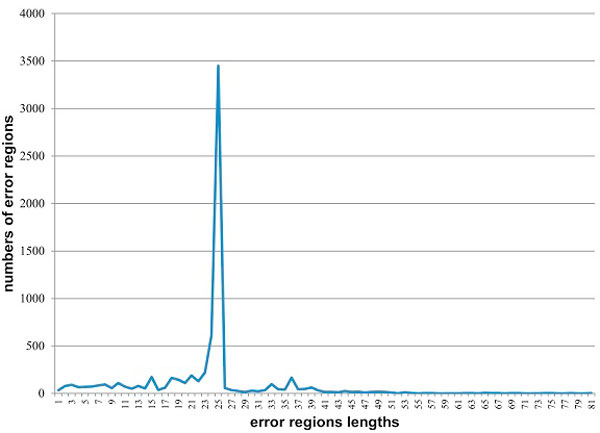
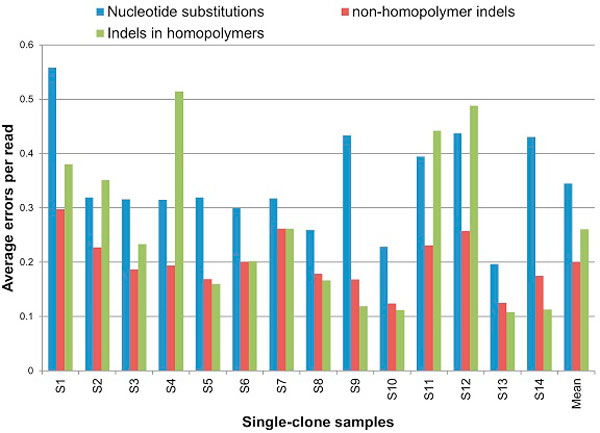
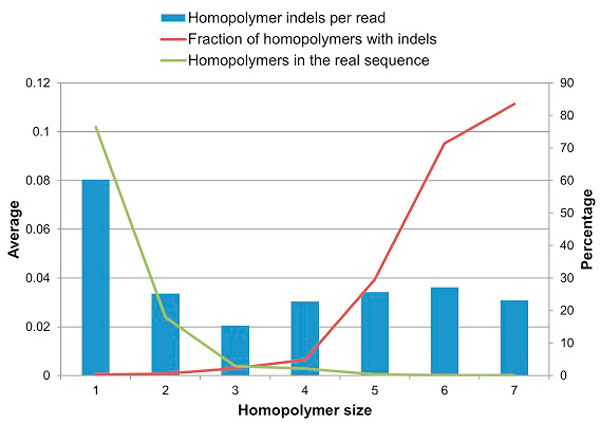
Background: Next-generation sequencing allows the analysis of an unprecedented number of viral sequence variants from infected patients, presenting a novel opportunity for understanding virus evolution, drug resistance and immune escape. However, sequencing in bulk is error prone. Thus, the generated data require error identification and correction. Most error-correction methods to date are not optimized for amplicon analysis and assume that the error rate is randomly distributed. Recent quality assessment of amplicon sequences obtained using 454-sequencing showed that the error rate is strongly linked to the presence and size of homopolymers, position in the sequence and length of the amplicon. All these parameters are strongly sequence specific and should be incorporated into the calibration of error-correction algorithms designed for amplicon sequencing.
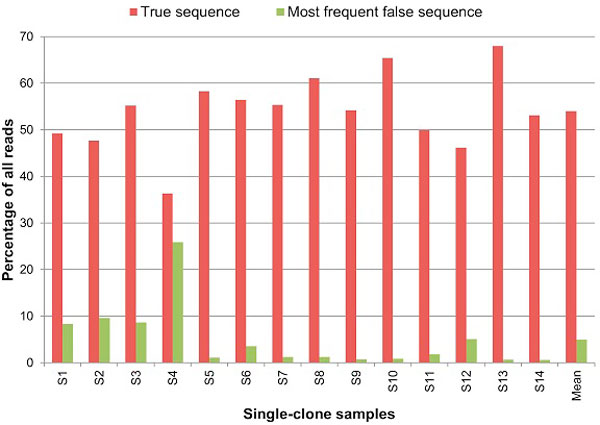
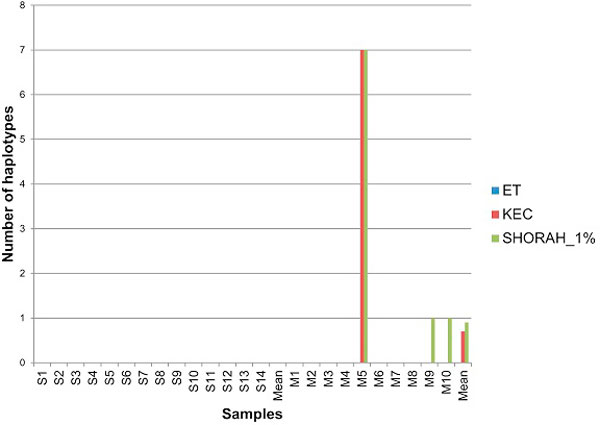
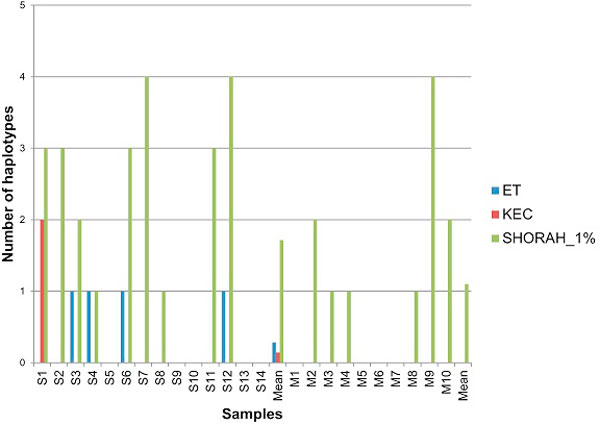
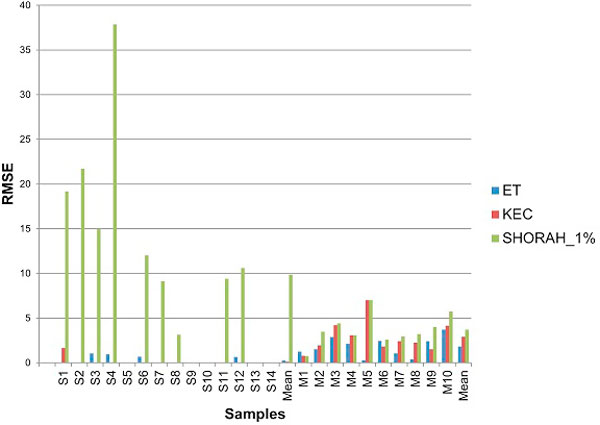
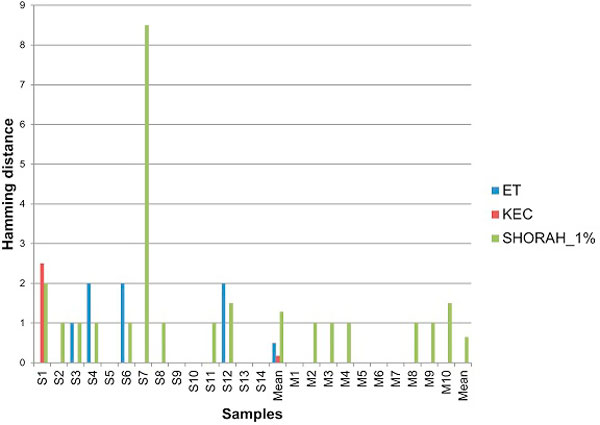
Results: In this paper, we present two new efficient error correction algorithms optimized for viral amplicons: (i) k-mer-based error correction (KEC) and (ii) empirical frequency threshold (ET). Both were compared to a previously published clustering algorithm (SHORAH), in order to evaluate their relative performance on 24 experimental datasets obtained by 454-sequencing of amplicons with known sequences. All three algorithms show similar accuracy in finding true haplotypes. However, KEC and ET were significantly more efficient than SHORAH in removing false haplotypes and estimating the frequency of true ones.
Conclusions: Both algorithms, KEC and ET, are highly suitable for rapid recovery of error-free haplotypes obtained by 454-sequencing of amplicons from heterogeneous viruses.The implementations of the algorithms and data sets used for their testing are available at: http://alan.cs.gsu.edu/NGS/?q=content/pyrosequencing-error-correction-algorithm.
Figures
Similar articles
-
Computational framework for next-generation sequencing of heterogeneous viral populations using combinatorial pooling.Bioinformatics. 2015 Mar 1;31(5):682-90. doi: 10.1093/bioinformatics/btu726. Epub 2014 Oct 29. Bioinformatics. 2015. PMID: 25359889
-
Reconstruction of viral population structure from next-generation sequencing data using multicommodity flows.BMC Bioinformatics. 2013;14 Suppl 9(Suppl 9):S2. doi: 10.1186/1471-2105-14-S9-S2. Epub 2013 Jun 28. BMC Bioinformatics. 2013. PMID: 23902469 Free PMC article.
-
A comparative study of k-spectrum-based error correction methods for next-generation sequencing data analysis.Hum Genomics. 2016 Jul 25;10 Suppl 2(Suppl 2):20. doi: 10.1186/s40246-016-0068-0. Hum Genomics. 2016. PMID: 27461106 Free PMC article.
-
Recent advances in inferring viral diversity from high-throughput sequencing data.Virus Res. 2017 Jul 15;239:17-32. doi: 10.1016/j.virusres.2016.09.016. Epub 2016 Sep 28. Virus Res. 2017. PMID: 27693290 Review.
-
A survey of error-correction methods for next-generation sequencing.Brief Bioinform. 2013 Jan;14(1):56-66. doi: 10.1093/bib/bbs015. Epub 2012 Apr 6. Brief Bioinform. 2013. PMID: 22492192 Review.
Cited by
-
Error correction and statistical analyses for intra-host comparisons of feline immunodeficiency virus diversity from high-throughput sequencing data.BMC Bioinformatics. 2015 Jun 30;16:202. doi: 10.1186/s12859-015-0607-z. BMC Bioinformatics. 2015. PMID: 26123018 Free PMC article.
-
SeekDeep: single-base resolution de novo clustering for amplicon deep sequencing.Nucleic Acids Res. 2018 Feb 28;46(4):e21. doi: 10.1093/nar/gkx1201. Nucleic Acids Res. 2018. PMID: 29202193 Free PMC article.
-
Deep-sequencing of the peach latent mosaic viroid reveals new aspects of population heterogeneity.PLoS One. 2014 Jan 30;9(1):e87297. doi: 10.1371/journal.pone.0087297. eCollection 2014. PLoS One. 2014. PMID: 24498066 Free PMC article.
-
HIV-1 tropism dynamics and phylogenetic analysis from longitudinal ultra-deep sequencing data of CCR5- and CXCR4-using variants.PLoS One. 2014 Jul 17;9(7):e102857. doi: 10.1371/journal.pone.0102857. eCollection 2014. PLoS One. 2014. PMID: 25032817 Free PMC article.
-
Transmissibility of intra-host hepatitis C virus variants.BMC Genomics. 2017 Dec 6;18(Suppl 10):881. doi: 10.1186/s12864-017-4267-4. BMC Genomics. 2017. PMID: 29244001 Free PMC article.
References
-
- Zagordi O, Geyrhofer L, Roth V, Beerenwinkel N. Deep sequencing of a genetically heterogeneous sample: local haplotype reconstruction and read error correction. Journal of Computational Biology. 2009;17(417-428) - PubMed
Publication types
MeSH terms
Substances
LinkOut - more resources
Full Text Sources
Other Literature Sources
Miscellaneous
