

Application of change point analysis to daily influenza-like illness emergency department visits
- PMID: 22759619
- PMCID: PMC3534458
- DOI: 10.1136/amiajnl-2011-000793
Application of change point analysis to daily influenza-like illness emergency department visits
Abstract
Background: The utility of healthcare utilization data from US emergency departments (EDs) for rapid monitoring of changes in influenza-like illness (ILI) activity was highlighted during the recent influenza A (H1N1) pandemic. Monitoring has tended to rely on detection algorithms, such as the Early Aberration Reporting System (EARS), which are limited in their ability to detect subtle changes and identify disease trends.
Objective: To evaluate a complementary approach, change point analysis (CPA), for detecting changes in the incidence of ED visits due to ILI.
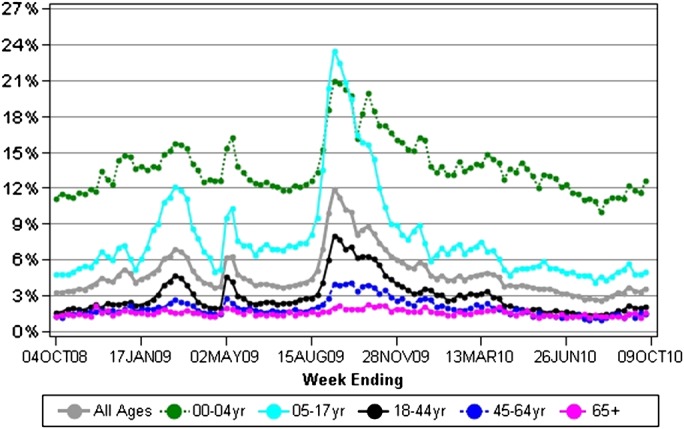
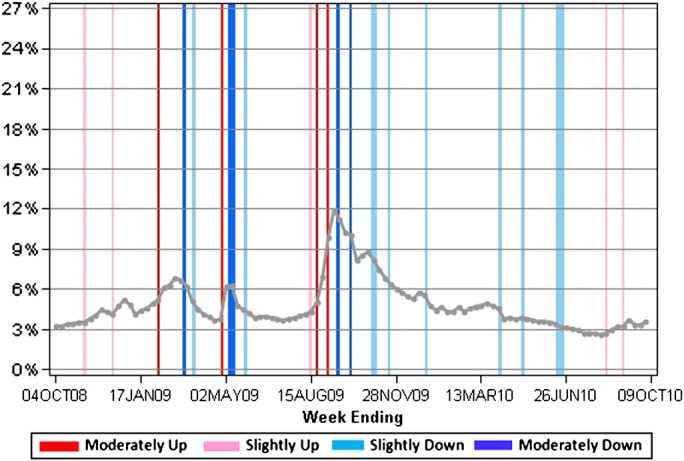
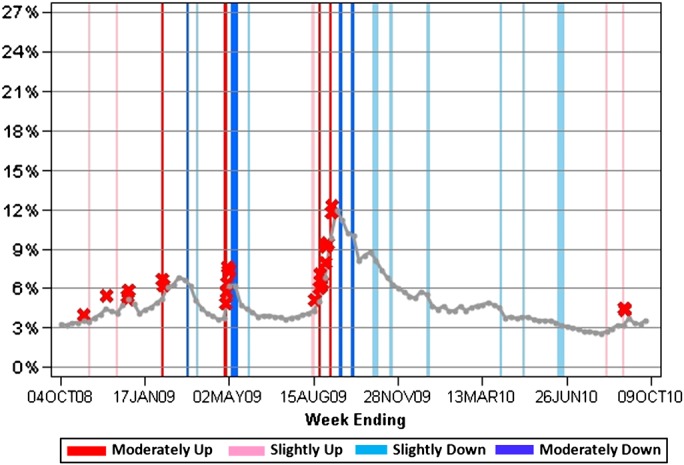
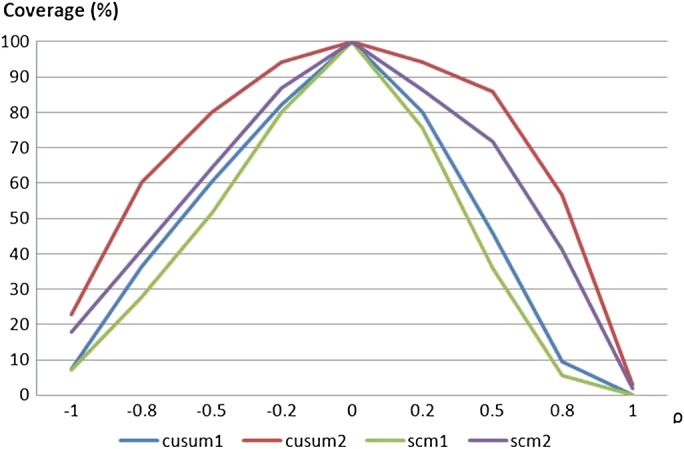
Methodology and principal findings: Data collected through the Distribute project (isdsdistribute.org), which aggregates data on ED visits for ILI from over 50 syndromic surveillance systems operated by state or local public health departments were used. The performance was compared of the cumulative sum (CUSUM) CPA method in combination with EARS and the performance of three CPA methods (CUSUM, structural change model and Bayesian) in detecting change points in daily time-series data from four contiguous US states participating in the Distribute network. Simulation data were generated to assess the impact of autocorrelation inherent in these time-series data on CPA performance. The CUSUM CPA method was robust in detecting change points with respect to autocorrelation in time-series data (coverage rates at 90% when -0.2≤ρ≤0.2 and 80% when -0.5≤ρ≤0.5). During the 2008-9 season, 21 change points were detected and ILI trends increased significantly after 12 of these change points and decreased nine times. In the 2009-10 flu season, we detected 11 change points and ILI trends increased significantly after two of these change points and decreased nine times. Using CPA combined with EARS to analyze automatically daily ED-based ILI data, a significant increase was detected of 3% in ILI on April 27, 2009, followed by multiple anomalies in the ensuing days, suggesting the onset of the H1N1 pandemic in the four contiguous states.
Conclusions and significance: As a complementary approach to EARS and other aberration detection methods, the CPA method can be used as a tool to detect subtle changes in time-series data more effectively and determine the moving direction (ie, up, down, or stable) in ILI trends between change points. The combined use of EARS and CPA might greatly improve the accuracy of outbreak detection in syndromic surveillance systems.
Conflict of interest statement
Figures
References
-
- Buehler J, Sonricker A, Paladina M, et al. Syndromic surveillance practice in the United states: findings from a survey of state, territorial, and selected local health departments. Adv Dis Surv 2008;6:1–20
-
- Buehler JW, Whitney EA, Smith D, et al. Situational uses of syndromic surveillance. Biosecur Bioterror 2009;7:165–77 - PubMed
Publication types
MeSH terms
LinkOut - more resources
Full Text Sources
Medical
Research Materials
Miscellaneous
