. 2012 Jul 15;26(14):1587-601.
doi: 10.1101/gad.192054.112. Epub 2012 Jul 3.

A Src family kinase-Shp2 axis controls RUNX1 activity in megakaryocyte and T-lymphocyte differentiation

Affiliations

A Src family kinase-Shp2 axis controls RUNX1 activity in megakaryocyte and T-lymphocyte differentiation

Hui Huang et al. Genes Dev. .

Abstract

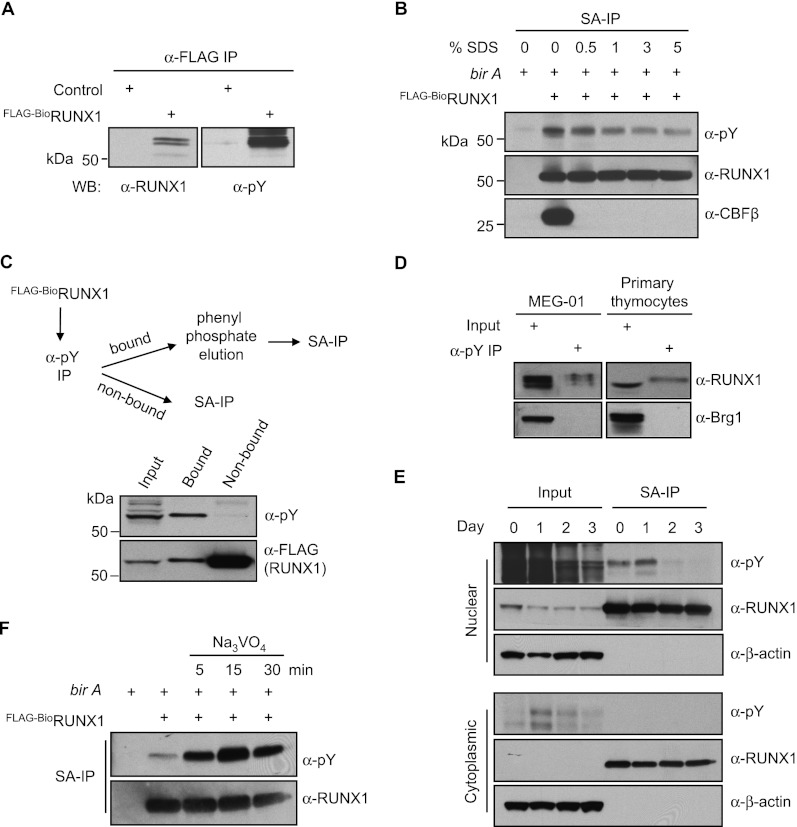
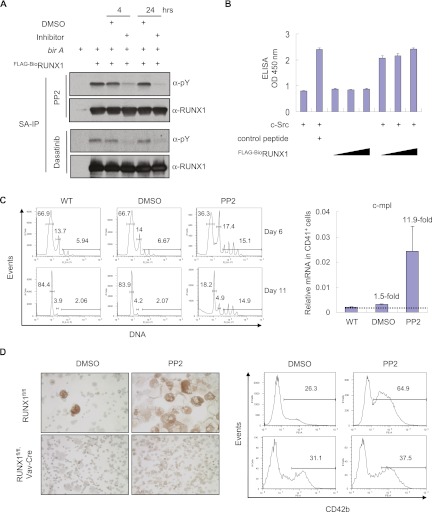
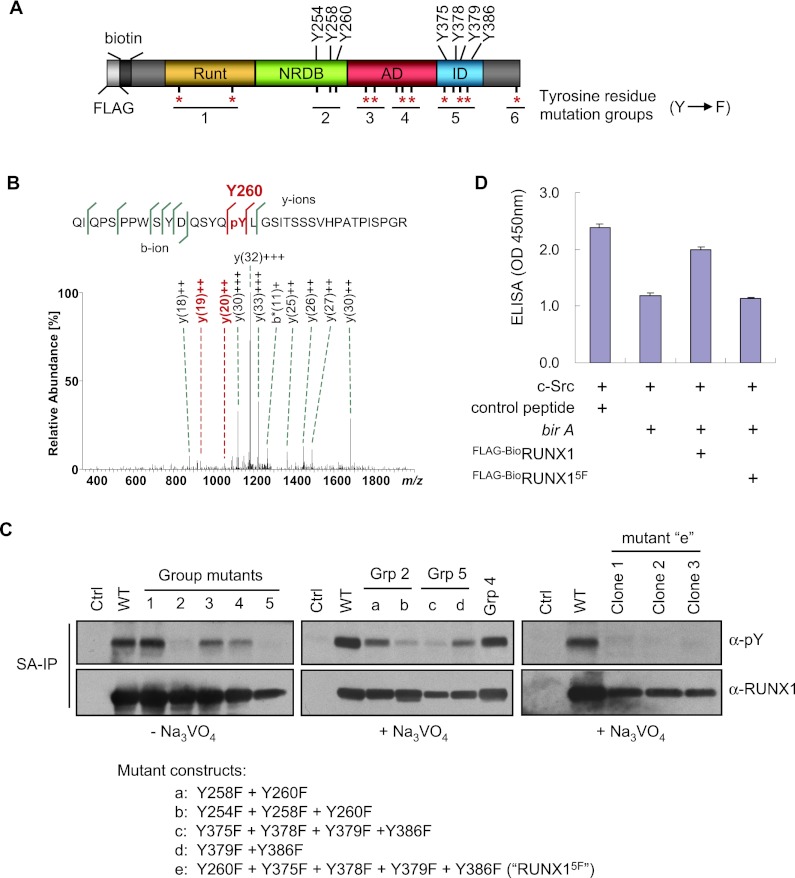
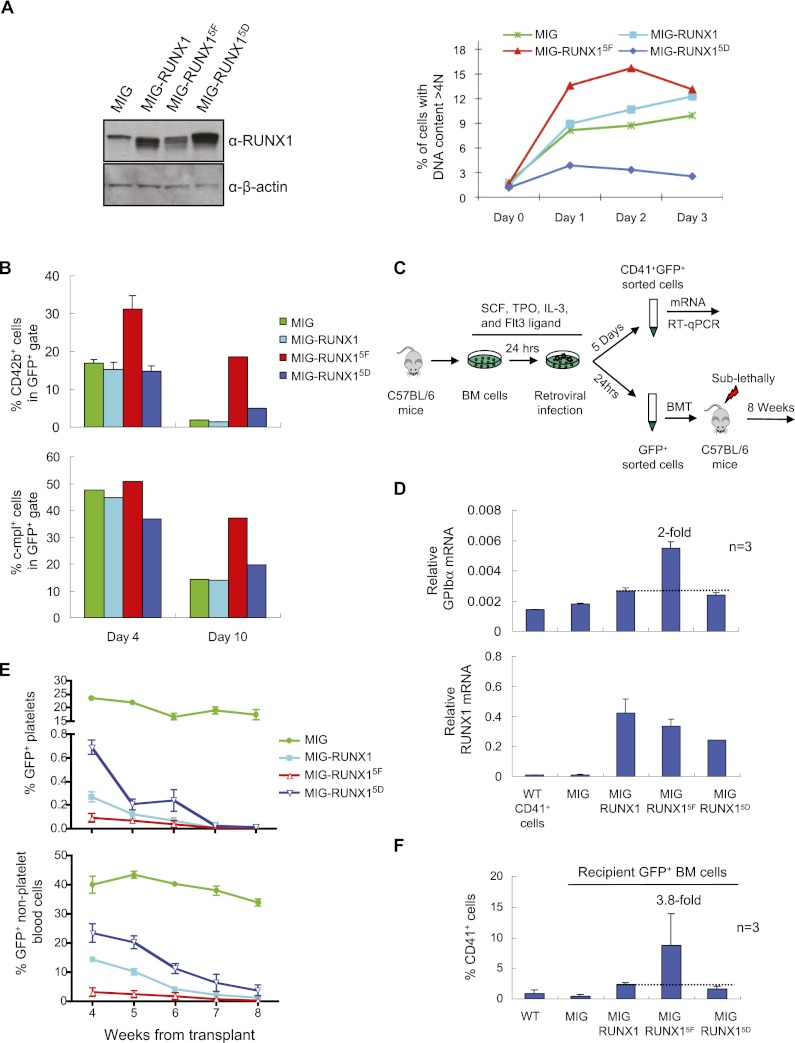
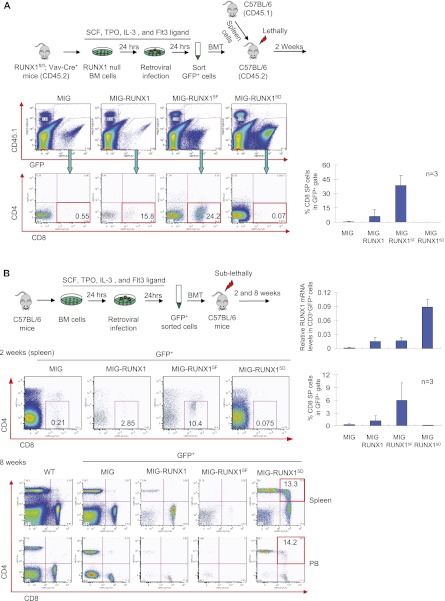
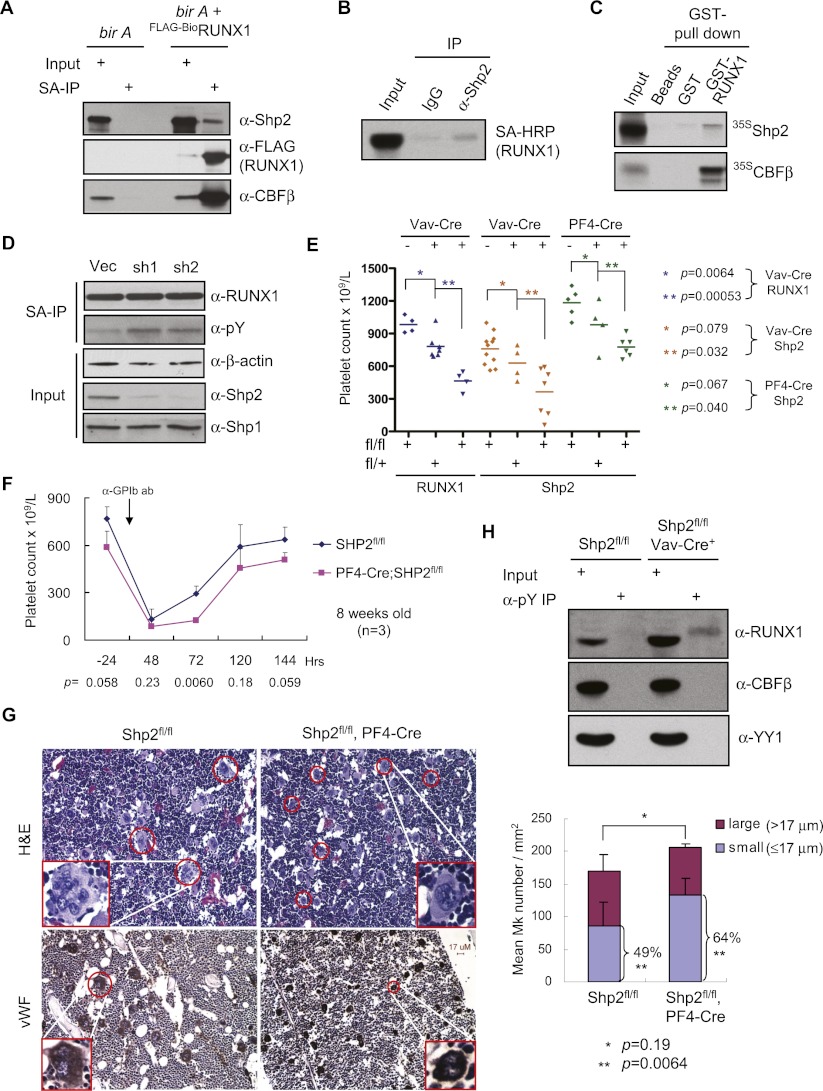
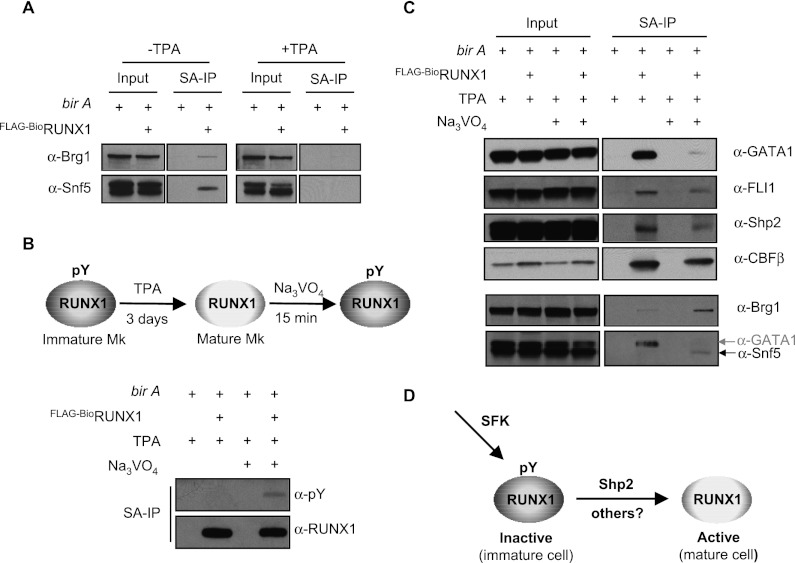
Hematopoietic development occurs in complex microenvironments and is influenced by key signaling events. Yet how these pathways communicate with master hematopoietic transcription factors to coordinate differentiation remains incompletely understood. The transcription factor RUNX1 plays essential roles in definitive hematopoietic stem cell (HSC) ontogeny, HSC maintenance, megakaryocyte (Mk) maturation, and lymphocyte differentiation. It is also the most frequent target of genetic alterations in human leukemia. Here, we report that RUNX1 is phosphorylated by Src family kinases (SFKs) and that this occurs on multiple tyrosine residues located within its negative regulatory DNA-binding and autoinhibitory domains. Retroviral transduction, chemical inhibitor, and genetic studies demonstrate a negative regulatory role of tyrosine phosphorylation on RUNX1 activity in Mk and CD8 T-cell differentiation. We also demonstrate that the nonreceptor tyrosine phosphatase Shp2 binds directly to RUNX1 and contributes to its dephosphorylation. Last, we show that RUNX1 tyrosine phosphorylation correlates with reduced GATA1 and enhanced SWI/SNF interactions. These findings link SFK and Shp2 signaling pathways to the regulation of RUNX1 activity in hematopoiesis via control of RUNX1 multiprotein complex assembly.


Figures

Figure 1.
Figure 1.
RUNX1 tyrosine phosphorylation. (A) Anti-Flag IP from nuclear extracts of control (nontransfected) or Flag-BioRUNX1-expressing uninduced L8057 cells. Western blot of the purified material for RUNX1 (left) and phosphotyrosine (pY) (right) is shown. (B) SA-IP of nuclear extracts from uninduced L8057 cells expressing Flag-BioRUNX1 with and without birA (biotin ligase) in the presence of increasing concentrations of SDS. Western blot of the purified material is shown for pY, RUNX1, and CBFβ. (C) Quantitation of RUNX1 tyrosine phosphorylation levels. Nuclear extracts from uninduced L8057 cells containing Flag-BioRUNX1were incubated with α-pY antibody-conjugated agarose beads. After washing, the bound material was eluted with excess phenyl phosphate. SA-IP was performed on both bound and nonbound fractions and examined by anti-pY and Flag Western blot; 0.5% of the input is shown. (D) Tyrosine phosphorylation of endogenous RUNX1 from human MEG-01 cells and primary murine thymocytes. Nuclear extracts from MEG-01 cells or whole-cell lysates from primary thymocytes of 6-wk-old C57BL/6 mice were incubated with α-pY-bound beads. After washing, the bound material was eluted with 100 mM phenyl phosphate and examined by Western blot for RUNX1 and Brg1 (negative control). For MEG-01, 1.25% of the input is shown (25 μg of nuclear extract), and 0.5% input is shown for primary thymocytes (90 μg of whole-cell lysate). (E) Loss of RUNX1 tyrosine phosphorylation upon TPA-induced maturation of L8057 cells. SA-IP and α-pY Western blot of Flag-BioRUNX1 from nuclear extracts or cytoplasmic fractions of L8057 cells treated with 50 nM TPA for the indicated number of days; 1% of the input is shown. (F) Enhanced RUNX1 tyrosine phosphorylation with inhibition of tyrosine phosphatases. SA-IP and α-pY Western blot of Flag-BioRUNX1 from nuclear extracts of uninduced L8057 cells treated with 1.25 mM Na3VO4 for the indicated time.
Figure 2.
Figure 2.
RUNX1 tyrosine phosphorylation by Src family kinases. (A) Inhibition of RUNX1 tyrosine phosphorylation with the SFK inhibitors PP2 or Dasatinib. SA-IP and α-pY Western blot of Flag-BioRUNX1 from nuclear extracts of uninduced L8057 cells treated with DMSO, 10 μM PP2, or 10 μM Dasatinib for 4 or 24 h. (B) c-Src in vitro phosphorylation of RUNX1. Purified recombinant c-Src was incubated with SA-purified Flag-Bio-RUNX1 from TPA-induced L8057 cells, washed with 3% SDS, and assayed by ELISA for pY. Control peptide is a known c-Src substrate, Tyr 160 (Cell Signaling). The data represent the mean of two measurements ± SEM. (C) SFK inhibition enhances megakaryopoiesis in fetal liver cultures. Flow cytometry plots for DNA content of whole murine E13.5 fetal liver cells cultured with 1% TPO conditioned medium with either no treatment (WT), DMSO, or 10 μM PP2 for 6 or 11 d. (Right panel) Quantitative RT–PCR (qRT–PCR) for c-mpl mRNA transcript levels from CD41+ flow-sorted cells from the same cultures on day 11. Levels are normalized to β-actin and represent the mean of two experiments ± SEM. (D, left) AChE stains of cytospun cells from E13.5 fetal liver cells of RUNX1fl/fl or RUNX1fl/fl, Vav-Cre mice (both also contain the Cre reporter allele Rosa26-flox-stopper-flox-EYFP) cultured with TPO for 12 d and with 10 μM PP2 or DMSO for 11 d. Mks stain orange/brown. (Right) CD42b flow cytometry plots of cells taken from day 6 of the culture. For the Runx1fl/fl, Vav-Cre (Rosa26-flox-stopper-flox-EYFP) mice, cells were first gated for EYFP expression.
Figure 3.
Figure 3.
Mapping of RUNX1 phosphorylated tyrosine residues. (A) Schematic diagram of RUNX1 (murine isoform 3) showing positions of its 15 tyrosine residues relative to functional domains. The most highly conserved tyrosine residues among species and different RUNX family members are indicated with a red asterisk (see Supplemental Fig. S4 for more details). The groups of tyrosine residues mutated to phenylalanine are indicated. (RUNT) rnt homology domain (DNA- and CBFβ-binding domain). (B) Fragment ion mass spectrum of the tryptic peptide QIQPSPPWSYDQSYQpYLGSITSSSVHPATPISPGR indicating phosphorylation of Tyr 260 (murine isoform 3 numbering). The y192+ and y202+ (both shown in red) localize the phosphorylation site to Y260. (C) SA-IP and α-pY Western blot of uninduced L8057 cells stably expressing Flag-BioRUNX1 group mutants (as shown in A). (Left panel) Cells without Na3VO4 treatment. (Middle and right panels) Cells were treated with 1.25 mM Na3VO4 for 15 min prior to SA-IP. (Right panel) Three independent clonal cell lines are shown. (D) c-Src in vitro kinase assay of Flag-BioRUNX1 and Flag-BioRUNX15F purified by streptavidin pull-down from TPA-induced L8057 cells. The data represent the mean of three measurements ± SEM. See the legend for Figure 2B for additional details.
Figure 4.
Figure 4.
Inhibitory role of tyrosine phosphorylation on RUNX1 function in megakaryopoiesis. (A) Retroviral expression of RUNX1 phosphorylation mutants in L8057 cells. (Left) RUNX1 Western blot of GFP+-sorted L8057 cells retrovirally transduced with the empty vector (MIG), wild-type RUNX1 (MIG-RUNX1), RUNX1Y260F, Y375F, Y378F, Y379F, Y386F (MIG-RUNX15F), or RUNX1Y260D, Y375D, Y378D, Y379D, Y386D (MIG-RUNX15D). (Right) DNA ploidy analysis of the cells induced with 50 nM TPA for the indicated time. The percentage of cells with DNA content >4N is shown. (B) Flow cytometry analysis of GFP+ cells for CD42b and c-mpl expression of E13.5 murine fetal liver cells transduced with each of the retroviral constructs and placed in liquid culture with TPO for either 4 or 10 d. (C) Schematic diagram of retroviral transduction experiments of bone marrow from C57BL/6 wild-type mice. (D) qRT–PCR analysis for GPIbα and RUNX1 mRNA transcripts in GFP+CD41+ or CD41+ wild-type cells flow-sorted after 5 d of liquid culture with TPO. Measurements were normalized to β-actin mRNA levels and represent the mean of three experiments ± SEM. Fold change relative to wild-type RUNX1 is indicated. (E) Loss of engraftment with overexpression of RUNX1 and RUNX1 tyrosine phosphorylation mutants. The percentage of GFP+ platelets (top) or all other GFP+ peripheral blood cells (bottom) in recipient mice at the indicated time from transplant is shown. An equal number of GFP+ cells were injected into each mouse at the start of the transplant. (F) Flow cytometry analysis of GFP+ bone marrow cells for CD41 expression in recipient mice 8 wk following transplant. Measurements represent the mean of three experiments ± SEM. The fold change relative to wild-type RUNX1 is indicated.
Figure 5.
Figure 5.
Inhibitory role of tyrosine phosphorylation on RUNX1 function in CD8 T-cell differentiation. (A) Rescue assay of CD8 T-cell differentiation. (Top) Schematic diagram of retroviral transduction rescue experiments of bone marrow from Runx1fl/fl, Vav-Cre mice. (Bottom left) Representative flow cytometric plots for GFP, CD45.1, CD4, and CD8 of spleen cells from recipient mice 2 wk following transplantation. (Right) Quantitation of flow cytometry data (n = 3; error bars represent mean ± SEM). (B) Dominant effects of RUNX1 tyrosine phosphorylation mutants on T-cell differentiation. (Top left) Schematic diagram of retroviral transduction experiments of bone marrow from wild-type C57BL/6 mice. (Bottom) Representative flow cytometry plots for CD4 and CD8 of GFP+ cells from spleen or peripheral blood (PB) at 2 or 8 wk following transplantation. (Top right) qRT–PCR analysis for RUNX1 mRNA levels from CD3+GFP+-sorted splenocytes at 2 wk. (Bottom right) Quantitation of the flow cytometry data at 2 wk (n = 3; mean ± SEM).
Figure 6.
Figure 6.
Contribution of Shp2 to RUNX1 tyrosine dephosphorylation. (A) SA-IP of Flag-BioRUNX1 from TPA-induced L8057 cells. Western blots of the copurified material for Shp-2, RUNX1 (Flag), and CBFβ are shown; 1% of input is shown. (B) Co-IP of endogenous Shp2 and Flag-BioRUNX1 from TPA-induced L8057 cells. (IgG) Species-matched control antibody; 1.35% of input is shown. (C) GST pull-down of bacterially produced GST-RUNX1 and in vitro transcribed and translated [35S]-labeled Shp2 or CBF-β. Autoradiograms of the eluted material and 10% of the input are shown. (D) SA-IP and anti-pY Western blot of uninduced L8057 cells containing Flag-BioRUNX1 transduced with the empty vector or two independent lentiviral Shp2-targeting shRNA constructs. (E) Peripheral blood platelet counts of RUNX1fl/fl, Vav-Cre (7 wk old); Shp2fl/fl, Vav-Cre (6 wk old); and Shp2fl/fl, PF4-Cre (8 wk old) mice with different allele doses. Horizontal bars represent mean values. P-values are based on Student's one-tailed t-test. (F) Peripheral blood platelet counts of Shp2fl/fl or Shp2fl/fl, PF4-Cre 8-wk-old mice before and after anti-GPIbα antibody injection. n = 3 for both genotypes. P-values are indicated for each time point (Student's one-tailed t-test). (G, left) Hematoxylin/eosin stains of bone marrow from Shp2fl/fl or Shp2fl/fl, PF4-Cre mice obtained 72 h after anti-GPIbα antibody injection. Original magnification, 200×. Representative morphologically recognizable Mks are circled in red. (Insets) Enlarged representative Mks. (Bottom) von Willebrand factor (vWF) (Mk marker) in situ immunohistochemistry of bone marrow sections. (Right) Quantification of vWF+ cells per square millimeter is given. Small Mks are defined as having a maximum diameter of ≤17 μm (Long and Williams 1981). (H) RUNX1 tyrosine phosphorylation levels in thymocytes from 6-wk-old Shp2fl/fl, Vav-Cre or Shp2fl/fl littermates. Thymocyte extracts were incubated with anti-pY antibody-coupled beads. After washing, the bound beads were eluted using 100 mM phenyl phosphate. The eluates were examined by Western blot for RUNX1, CBFβ (negative control) and YY1 (negative control); 0.5% of the input is shown (50 μg of whole-cell lysate).
Figure 7.
Figure 7.
Correlation of altered RUNX1 protein–protein interactions with tyrosine phosphorylation. (A) Loss of interaction between RUNX1 and SWI/SNF core components Brg1 and Snf5 during TPA-induced L8057 maturation. SA-IP of Flag-BioRUNX1 and Western blots for Brg1 and Snf5 are shown; 5% of the input is shown. (B) Restoration of RUNX1 tyrosine phosphorylation in TPA-induced L8057 cells treated with Na3VO4. SA-IP of Flag-BioRUNX1 in L8057 cells induced for 3 d with 50 nM TPA and treated for 15 min with DMSO or 1.25 mM Na3VO4. Western blot for pY and RUNX1 is shown. (C) Changes in RUNX1 protein–protein interactions associated with RUNX1 tyrosine phosphorylation restoration. SA-IP of Flag-BioRUNX1 in L8057 cells induced for 3 d with 50 nM TPA and treated for 15 min with DMSO or 1.25 mM Na3VO4. Western blots for GATA-1, FLI1, Shp2, CBFβ, Snf5, and Brg1 are shown; 0.5% of input is shown. (D) Schematic model for regulation of RUNX1 activity via SFKs and Shp2.

Comment in

Similar articles

Cited by

References

    1. Bakshi R, Hassan MQ, Pratap J, Lian JB, Montecino MA, van Wijnen AJ, Stein JL, Imbalzano AN, Stein GS 2010. The human SWI/SNF complex associates with RUNX1 to control transcription of hematopoietic target genes. J Cell Physiol 225: 569–576 - PMC - PubMed
    1. Bejar R, Stevenson K, Abdel-Wahab O, Galili N, Nilsson B, Garcia-Manero G, Kantarjian H, Raza A, Levine RL, Neuberg D, et al. 2011. Clinical effect of point mutations in myelodysplastic syndromes. N Engl J Med 364: 2496–2506 - PMC - PubMed
    1. Cai Z, de Bruijn M, Ma X, Dortland B, Luteijn T, Downing RJ, Dzierzak E 2000. Haploinsufficiency of AML1 affects the temporal and spatial generation of hematopoietic stem cells in the mouse embryo. Immunity 13: 423–431 - PubMed
    1. Challen GA, Goodell MA 2010. Runx1 isoforms show differential expression patterns during hematopoietic development but have similar functional effects in adult hematopoietic stem cells. Exp Hematol 38: 403–416 - PMC - PubMed
    1. Chen MJ, Yokomizo T, Zeigler BM, Dzierzak E, Speck NA 2009. Runx1 is required for the endothelial to haematopoietic cell transition but not thereafter. Nature 457: 887–891 - PMC - PubMed

Publication types

MeSH terms

Substances