. 2012 Sep 15;84(6):838-50.
doi: 10.1016/j.bcp.2012.06.018. Epub 2012 Jul 1.

p23 co-chaperone protects the aryl hydrocarbon receptor from degradation in mouse and human cell lines

Affiliations

p23 co-chaperone protects the aryl hydrocarbon receptor from degradation in mouse and human cell lines

Phuong Minh Nguyen et al. Biochem Pharmacol. .

Abstract

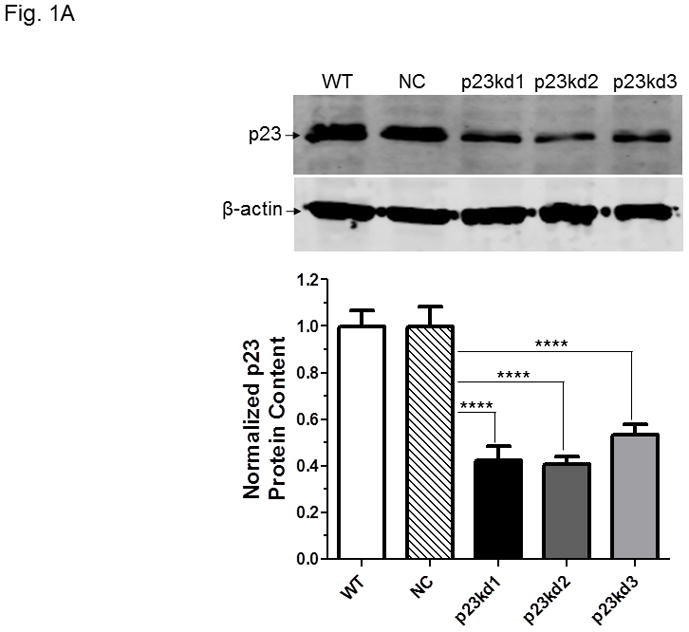
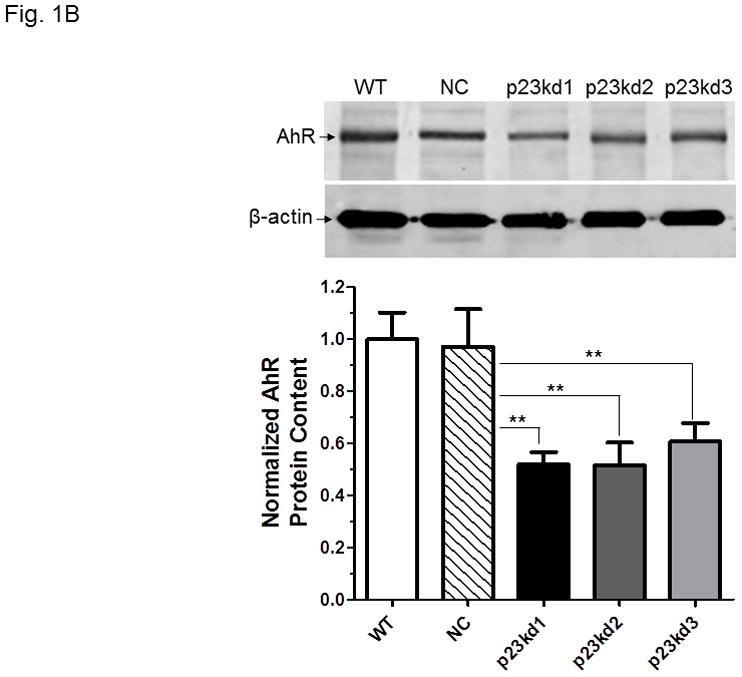
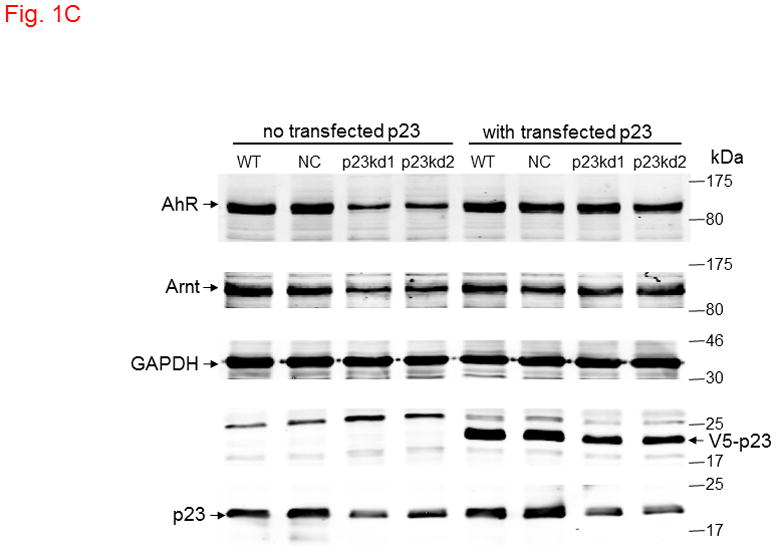
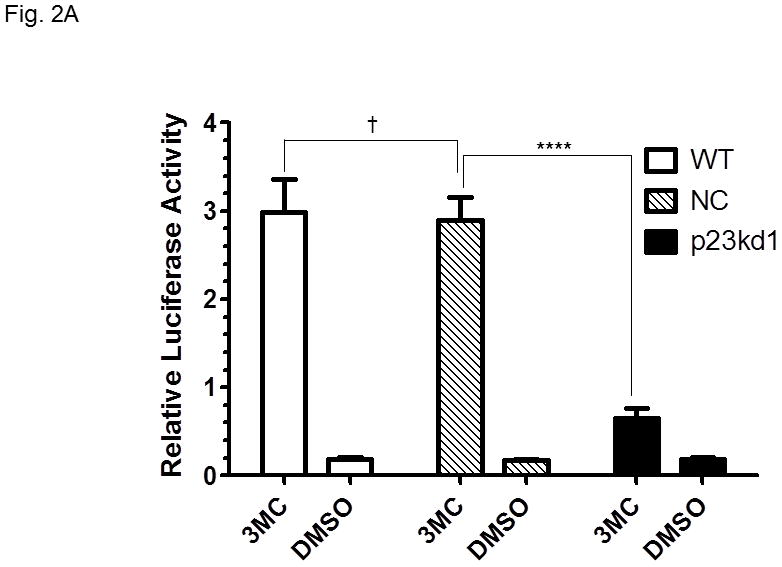
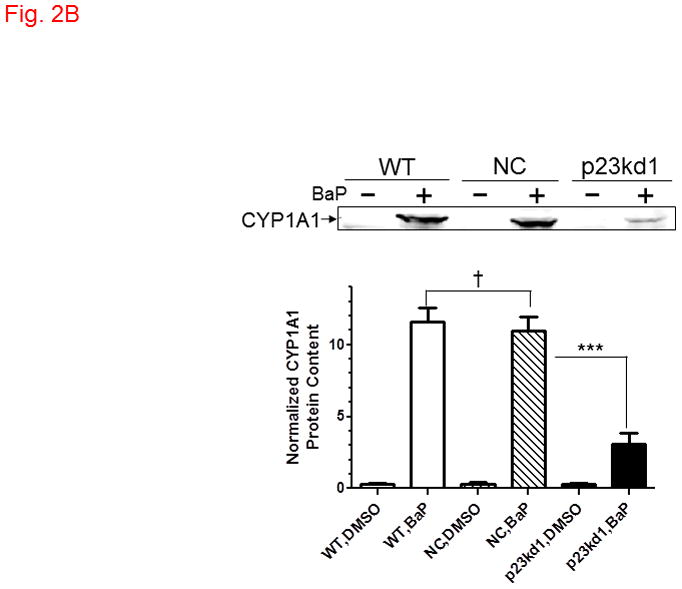
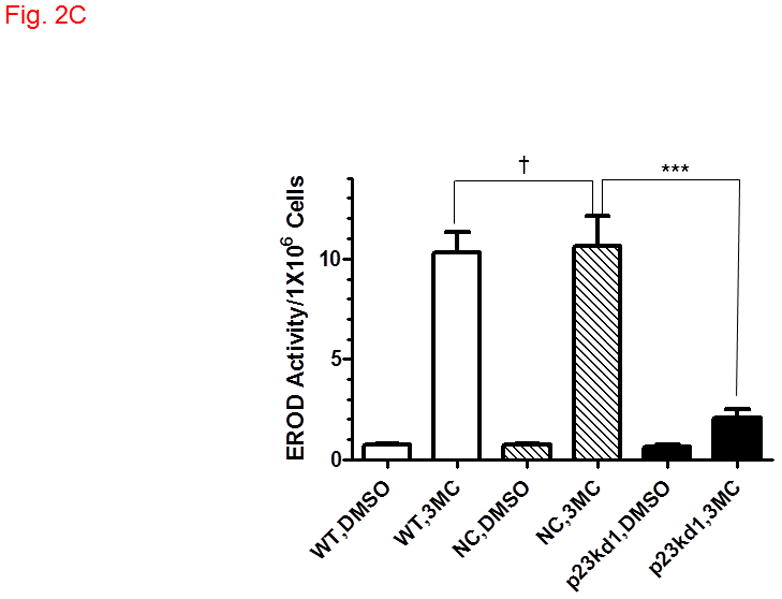
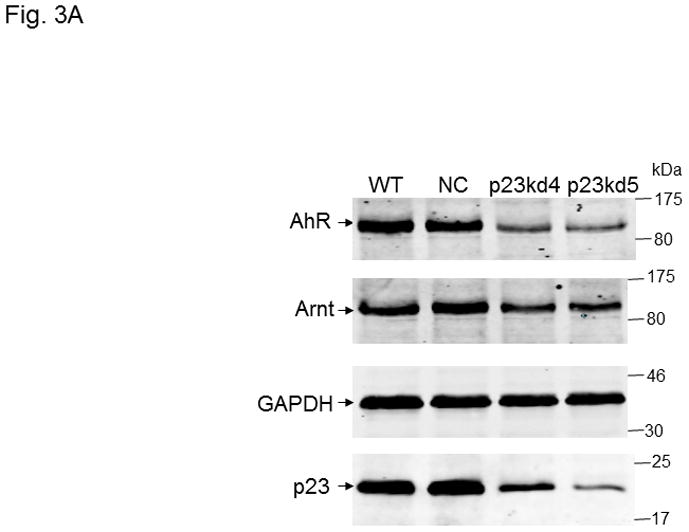
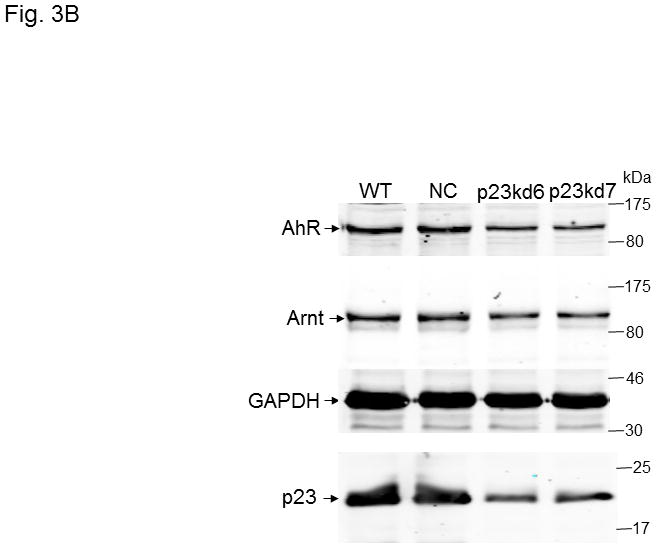
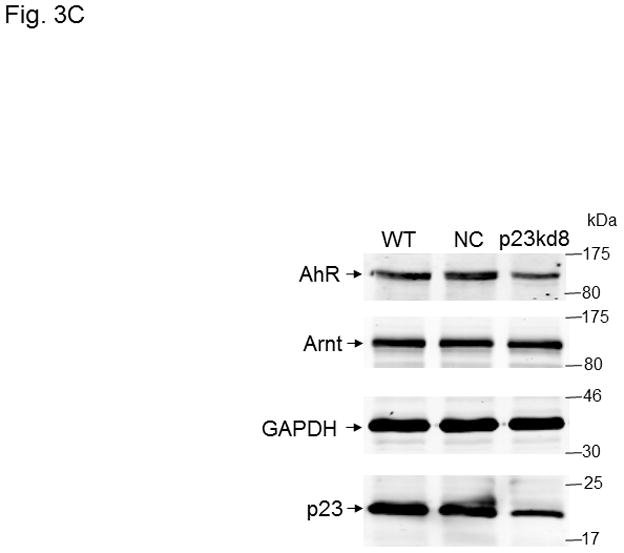
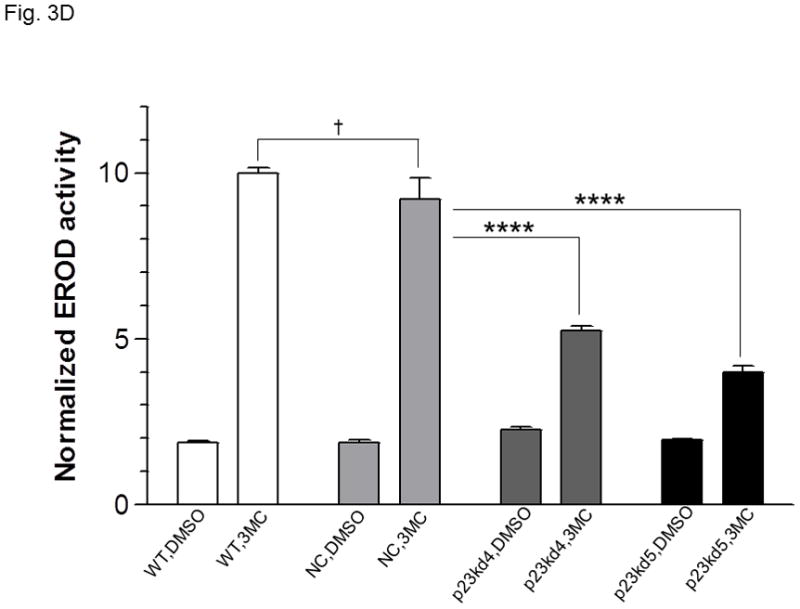
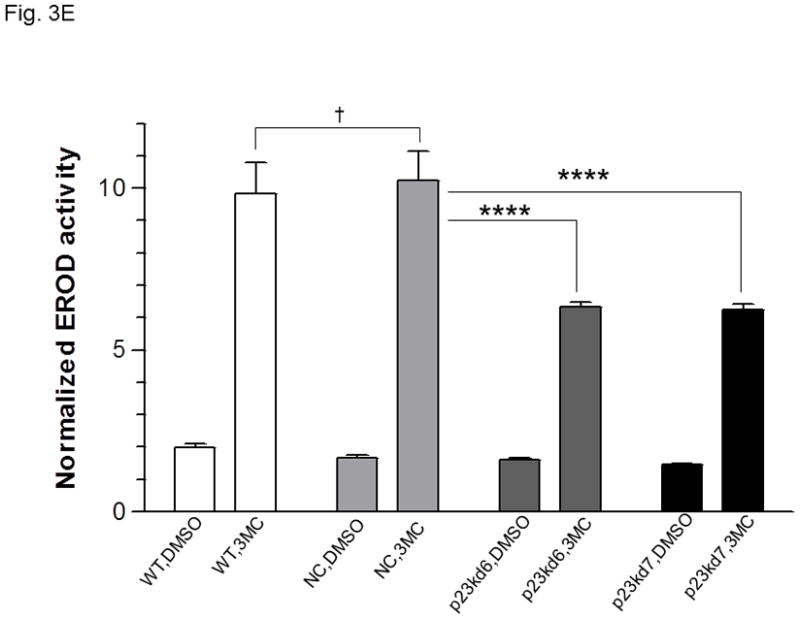
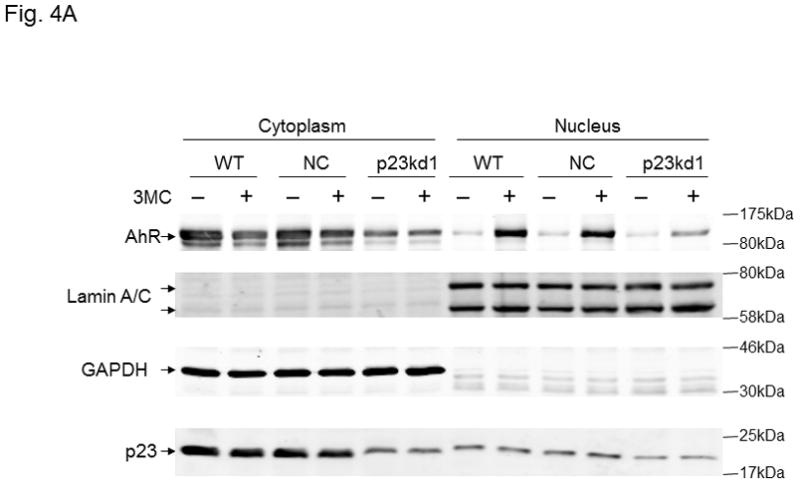
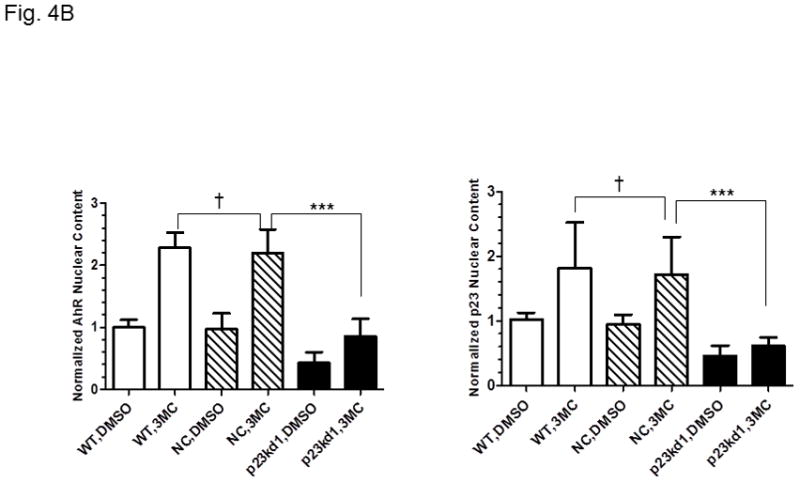
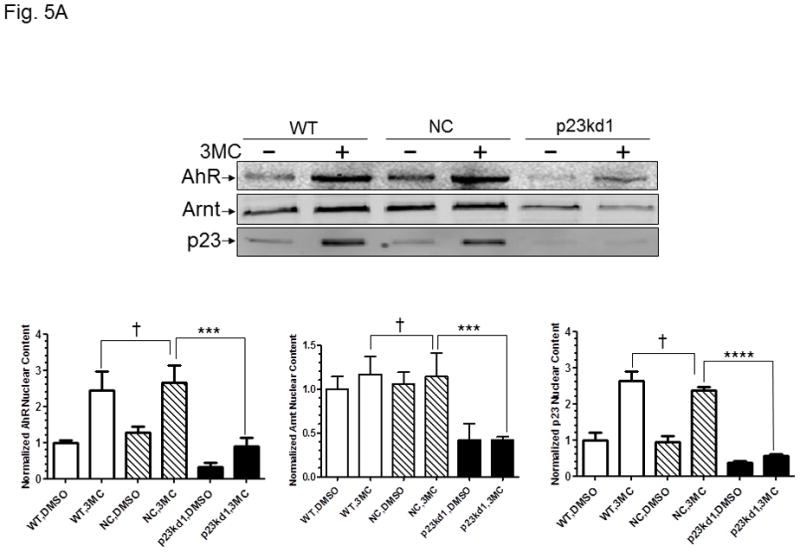
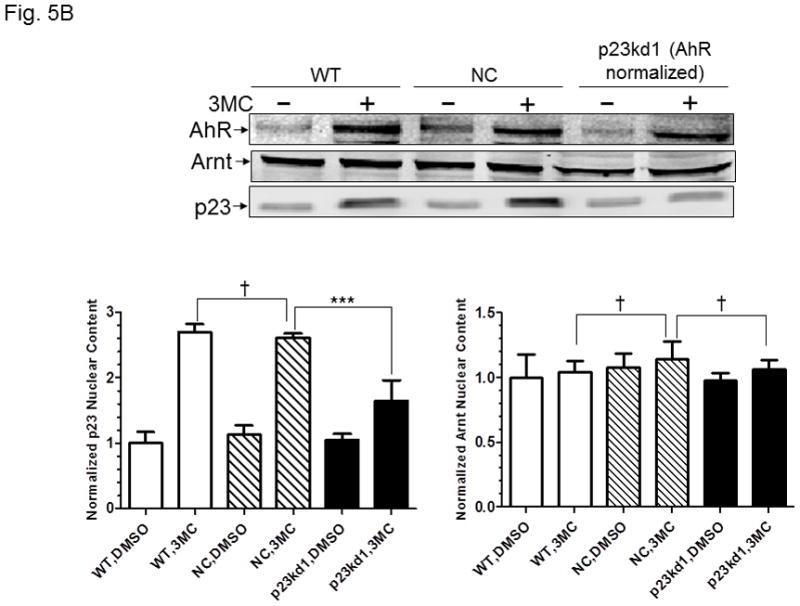
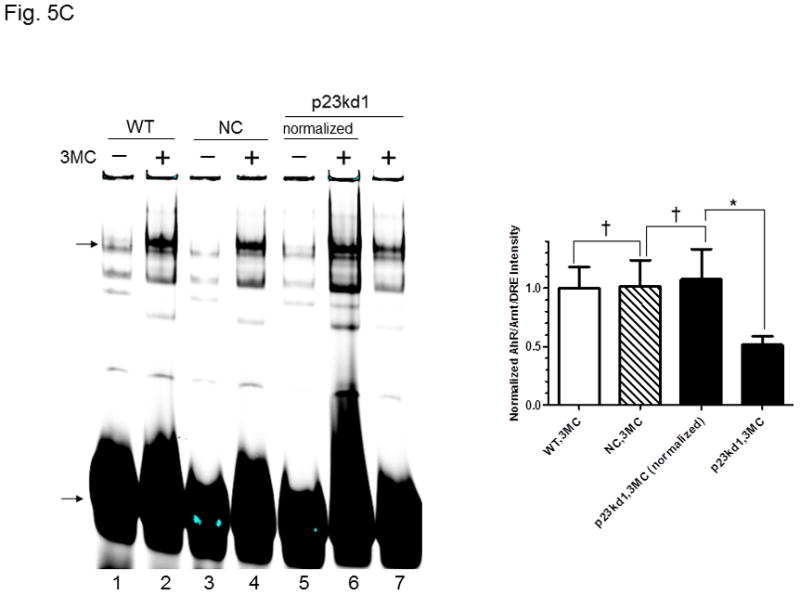
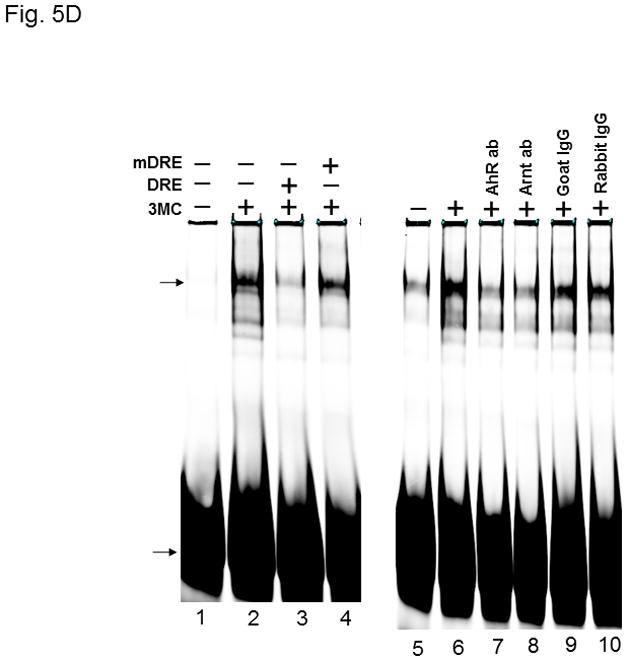
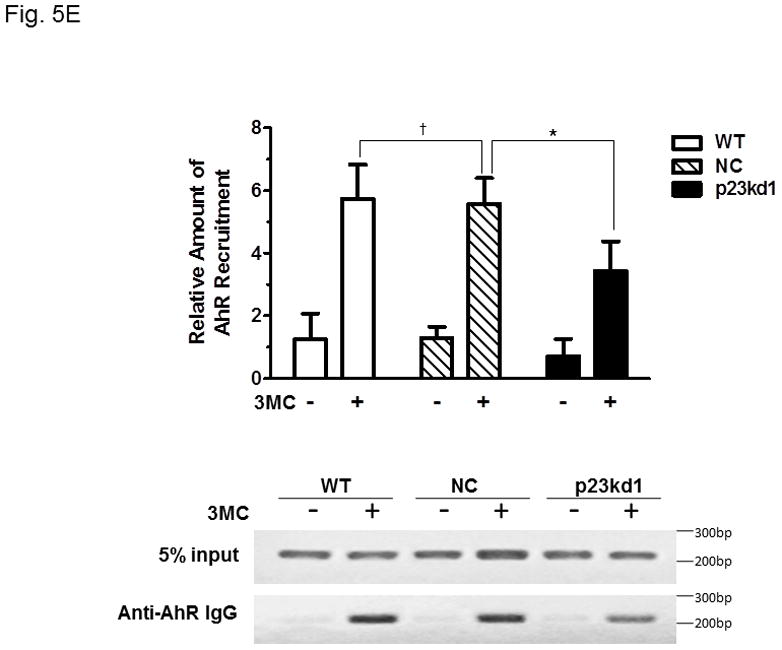
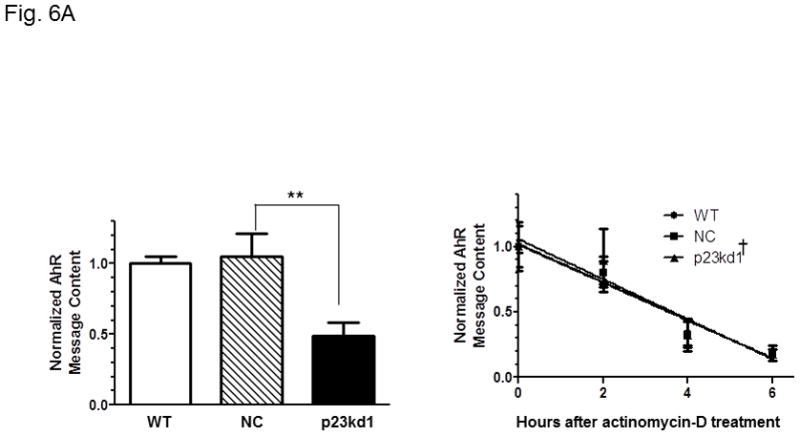
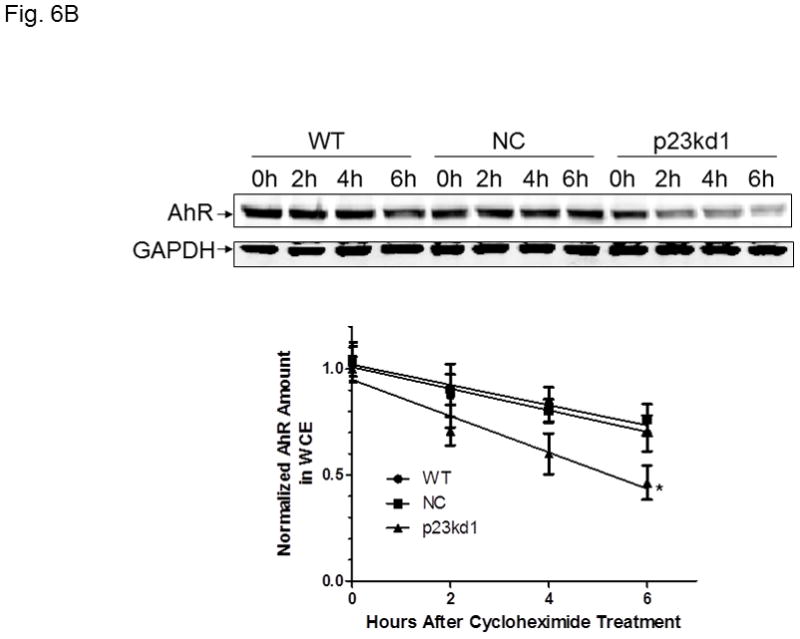
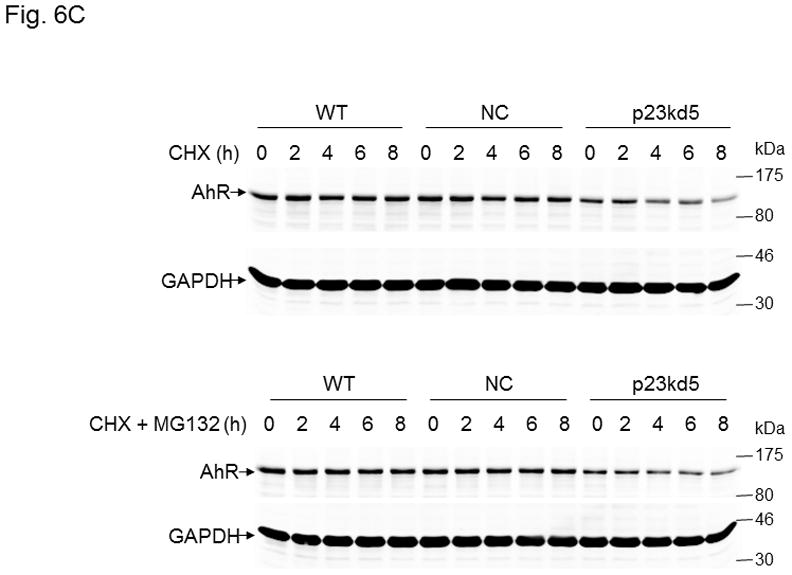
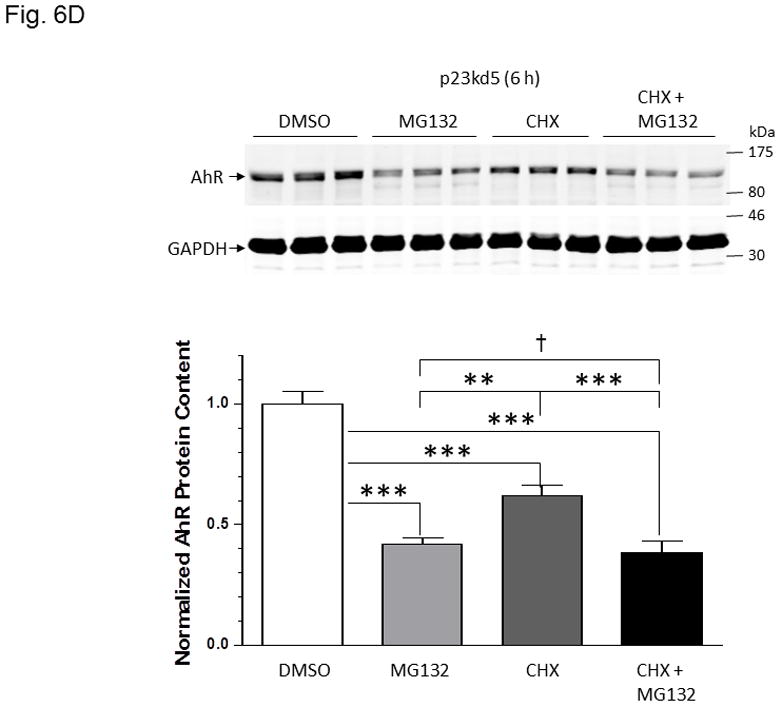
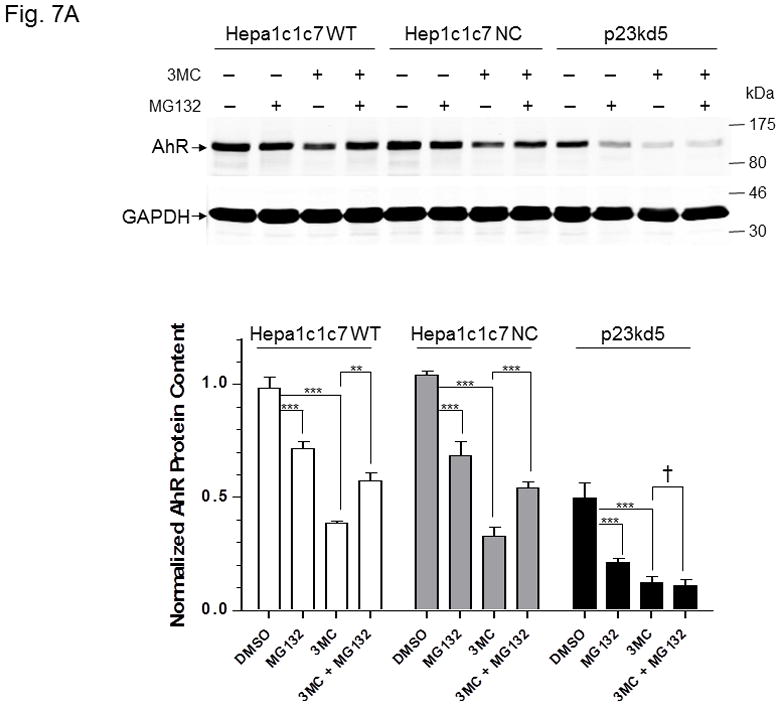
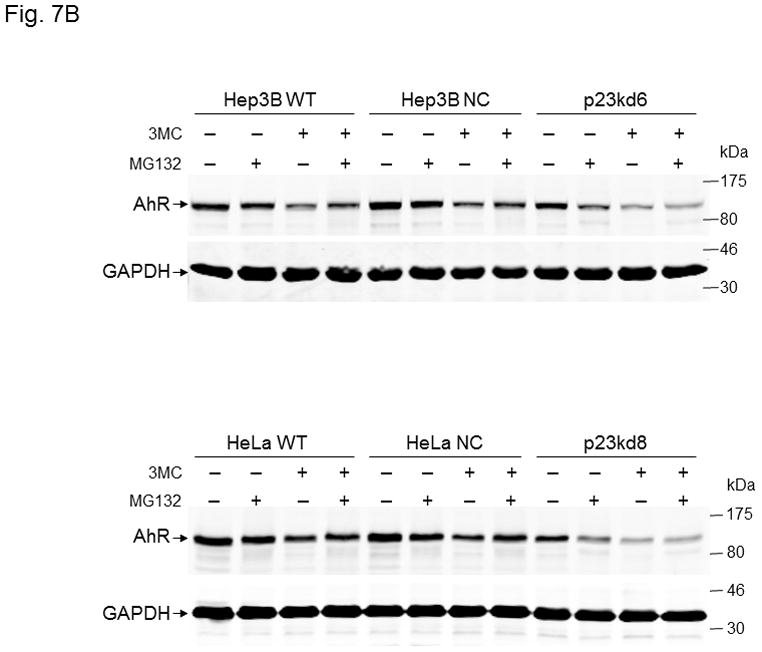
The aryl hydrocarbon receptor (AhR) is a ligand-sensitive transcription factor which is responsible for most 2,3,7,8-tetrachlorodibenzo-p-dioxin toxicities. Without ligand, the AhR complex is cytoplasmic and contains p23. Our objective was to investigate whether the wild type p23 levels are important for the AhR function. We generated eight p23-specific knockdown stable cell lines via either electroporation or lentiviral infection. Five of these stable cell lines were generated from a mouse hepatoma cell line (Hepa1c1c7) and three were from human hepatoma and cervical cell lines (Hep3B and HeLa). All of them expressed lower AhR protein levels, leading to reduced ligand-induced, DRE-driven downstream activity. The AhR protein levels in p23-specific knockdown stable cells were reversed back to wild type levels after exogenous p23 was introduced. Reduction of the AhR protein levels in these stable cells was caused by a decrease in the AhR message levels and an increase of the AhR protein degradation in the absence of ligand. This ligand-independent degradation of AhR was not reversed by MG132, suggesting that the 26S proteasome was not responsible for the degradation. In addition, MG132 could not protect AhR from the ligand-induced degradation in both mouse and human p23-knockdown stable cells.


Conflict of interest statement

Conflict of interest

None.

Figures

Fig. 1
Fig. 1
p23 and AhR protein levels in p23-specific knockdown stable Hepa1c1c7 cells generated by electroporation. Five cell lines examined: wild type (WT), negative control knockdown stable (NC), and p23 knockdown stable p23kd1-3. Western results showing p23 (A) and AhR (B) levels. Protein levels in WT are arbitrarily set as 1. Each lane contained 19–27 μg of whole cell extract and was normalized by β-actin. N-19 was used to detect AhR. The plot (bottom) is the quantified data showing the means with error bars (mean ± SD, n = 3). The images (above) are a representation of the triplicate data. C, Western results showing that V5-p23 restored the AhR levels in p23kd1-2 cells. Cells (3×10⁶ in 0.4 ml) were transfected with either pcDNA-V5 or pcDNA-V5-p23 plasmid (30 μg in 30 μl) by electroporation (190 V, 70 ms). After incubation at 37°C for 60 h, the cells were harvested and whole cell extract was prepared for Western analysis. Each lane contained 20 μg of whole cell extract. GAPDH was used for normalization. SA210 was used to detect AhR.
Fig. 1
Fig. 1
p23 and AhR protein levels in p23-specific knockdown stable Hepa1c1c7 cells generated by electroporation. Five cell lines examined: wild type (WT), negative control knockdown stable (NC), and p23 knockdown stable p23kd1-3. Western results showing p23 (A) and AhR (B) levels. Protein levels in WT are arbitrarily set as 1. Each lane contained 19–27 μg of whole cell extract and was normalized by β-actin. N-19 was used to detect AhR. The plot (bottom) is the quantified data showing the means with error bars (mean ± SD, n = 3). The images (above) are a representation of the triplicate data. C, Western results showing that V5-p23 restored the AhR levels in p23kd1-2 cells. Cells (3×10⁶ in 0.4 ml) were transfected with either pcDNA-V5 or pcDNA-V5-p23 plasmid (30 μg in 30 μl) by electroporation (190 V, 70 ms). After incubation at 37°C for 60 h, the cells were harvested and whole cell extract was prepared for Western analysis. Each lane contained 20 μg of whole cell extract. GAPDH was used for normalization. SA210 was used to detect AhR.
Fig. 2
Fig. 2
AhR downstream gene activation in p23kd1 cells. WT, wild type Hepa1c1c7; NC, negative control knockdown stable Hepa1c1c7; p23kd1, p23-specific knockdown stable Hepa1c1c7. A, DRE-driven luciferase activity in the presence of 1 μM 3-methylcholanthrene (3MC) or vehicle DMSO for 6 h. Cells were transfected with pGudLuc1.1 (400 ng) and β-galactosidase (50 ng) plasmids. The plot represents mean ± SD (n = 3). Luciferase activities were normalized by corresponding β-galactosidase activities. This experiment was repeated three times with similar results. B, CYP1A1 induction by 10 μM benzo[a]pyrene (BaP) for 12 h. Each lane contained 100 μg of microsomes for Western analysis. The plot below shows the means with error bars (mean ± SD, n = 3). The images above are a representation of the triplicate data. This experiment was repeated two times with similar results. C, a plot showing the EROD activity of CYP1A1. Induction was performed in a rotating cell suspension. The plot represents the means with error bars (mean ± SD, n = 3). Normalized EROD activity represents fluorescence units obtained from 1×10⁶ WT, NC, or p23kd1 cells with or without 3-methylcholanthrene (3MC) treatment. This experiment was also performed in a modified monolayer microplate format two times with similar results.
Fig. 2
Fig. 2
AhR downstream gene activation in p23kd1 cells. WT, wild type Hepa1c1c7; NC, negative control knockdown stable Hepa1c1c7; p23kd1, p23-specific knockdown stable Hepa1c1c7. A, DRE-driven luciferase activity in the presence of 1 μM 3-methylcholanthrene (3MC) or vehicle DMSO for 6 h. Cells were transfected with pGudLuc1.1 (400 ng) and β-galactosidase (50 ng) plasmids. The plot represents mean ± SD (n = 3). Luciferase activities were normalized by corresponding β-galactosidase activities. This experiment was repeated three times with similar results. B, CYP1A1 induction by 10 μM benzo[a]pyrene (BaP) for 12 h. Each lane contained 100 μg of microsomes for Western analysis. The plot below shows the means with error bars (mean ± SD, n = 3). The images above are a representation of the triplicate data. This experiment was repeated two times with similar results. C, a plot showing the EROD activity of CYP1A1. Induction was performed in a rotating cell suspension. The plot represents the means with error bars (mean ± SD, n = 3). Normalized EROD activity represents fluorescence units obtained from 1×10⁶ WT, NC, or p23kd1 cells with or without 3-methylcholanthrene (3MC) treatment. This experiment was also performed in a modified monolayer microplate format two times with similar results.
Fig. 3
Fig. 3
p23, AhR, and Arnt protein levels in p23-specific knockdown stable Hepa1c1c7 cells generated by lentiviral infection. Western results showing AhR, Arnt, and p23 levels in whole cell extract. Each lane contained 20 μg of whole cell extract and was normalized by GAPDH. A, wild type (WT), negative control knockdown stable (NC), and p23 knockdown stable p23kd4/5 Hepa1c1c7 cells. B, wild type (WT), negative control knockdown stable (NC), and p23 knockdown stable p23kd6/7 Hep3B cells. C, wild type (WT), negative control knockdown stable (NC), and p23 knockdown stable p23kd8 HeLa cells. SA210 was used to detect AhR. D and E, EROD activities of the lentivirus generated p23-specific knockdown stable cell lines Hepa1c1c7 (D, n = 3) and Hep3B (E, n = 4) with their corresponding wild type (WT) and negative control (NC) +/− 3-methylcholanthrene (3MC) treatment. The error bars represent means ± SD.
Fig. 3
Fig. 3
p23, AhR, and Arnt protein levels in p23-specific knockdown stable Hepa1c1c7 cells generated by lentiviral infection. Western results showing AhR, Arnt, and p23 levels in whole cell extract. Each lane contained 20 μg of whole cell extract and was normalized by GAPDH. A, wild type (WT), negative control knockdown stable (NC), and p23 knockdown stable p23kd4/5 Hepa1c1c7 cells. B, wild type (WT), negative control knockdown stable (NC), and p23 knockdown stable p23kd6/7 Hep3B cells. C, wild type (WT), negative control knockdown stable (NC), and p23 knockdown stable p23kd8 HeLa cells. SA210 was used to detect AhR. D and E, EROD activities of the lentivirus generated p23-specific knockdown stable cell lines Hepa1c1c7 (D, n = 3) and Hep3B (E, n = 4) with their corresponding wild type (WT) and negative control (NC) +/− 3-methylcholanthrene (3MC) treatment. The error bars represent means ± SD.
Fig. 4
Fig. 4
Cytoplasmic and nuclear levels of p23 and AhR in p23kd1 cells. WT, wild type Hepa1c1c7; NC, negative control knockdown stable Hepa1c1c7; p23kd1, p23-specific knockdown stable Hepa1c1c7. Cells were treated with 1 μM 3-methylcholanthrene (3MC) or vehicle DMSO alone for 1 h before fractionation. Each lane contained 20 μg of protein. GADPH and lamin A/C were marker controls for normalization for cytoplasmic and nuclear extracts, respectively. The Western images (A) are a representation of the replicate data. SA210 was used to detect AhR. Plots (B) showing the means with error bars (mean ± SD, n = 3 for left panel and n = 5 for right panel).
Fig. 4
Fig. 4
Cytoplasmic and nuclear levels of p23 and AhR in p23kd1 cells. WT, wild type Hepa1c1c7; NC, negative control knockdown stable Hepa1c1c7; p23kd1, p23-specific knockdown stable Hepa1c1c7. Cells were treated with 1 μM 3-methylcholanthrene (3MC) or vehicle DMSO alone for 1 h before fractionation. Each lane contained 20 μg of protein. GADPH and lamin A/C were marker controls for normalization for cytoplasmic and nuclear extracts, respectively. The Western images (A) are a representation of the replicate data. SA210 was used to detect AhR. Plots (B) showing the means with error bars (mean ± SD, n = 3 for left panel and n = 5 for right panel).
Fig. 5
Fig. 5
AhR/Arnt/DRE complex formation in p23kd1 Hepa1c1c7 nuclear extracts. A, Western results showing the amount of AhR, Arnt, and p23 in gel shift nuclear extracts with or without 3-methylcholanthrene (3MC) treatment (top). Each lane contained 20 μg of protein. The plot below shows the AhR (left), Arnt (middle) and p23 (right) levels with error bars (mean ± SD, n = 3). The images above are a presentation of the triplicate data. B, Western results showing the levels of Arnt and p23 in gel shift nuclear extracts when the AhR levels after 3-methylcholanthrene (3MC) treatment were normalized among the WT, NC, p23kd1 gel shift nuclear extract. More protein was loaded for p23kd1 nuclear extracts (+/− 3-methylcholanthrene). The plots below show the p23 (left) and Arnt (right) levels with error bars (mean ± SD, n = 3). The images above are a presentation of the triplicate data. N-19 was used to detect AhR in A and B. C, gel shift results of nuclear extracts from cells either treated with 3-methylcholanthrene (3MC) or vehicle DMSO alone for 1 h before harvest. Lanes 2, 4, 6 contained normalized amount of AhR whereas lanes 1–4, 7 contained normalized amount of protein (5 μg). The upper arrow indicates the AhR/Arnt/DRE complex whereas the lower arrow indicates the free probe. The plot (right) shows the means with error bars (mean ± SD, n = 3). The gel shift image (left) is a presentation of the triplicate data. D, controls to validate the AhR/Arnt/DRE complex. Each lane contained 5 μg of protein. Lanes 1–4 and 5–10 were from two separate gels. Lanes 2–4, 6–10 were 3-methylcholanthrene (3MC)-treated WT gel shift nuclear extract whereas lanes 1 and 5 were DMSO-treated WT extract. DRE, 5 pmol (10X) of unlabelled DRE; mDRE, 5pmol (10X) of unlabelled mutated DRE. 6 μg (3 μl) of IgG was added to samples at the end for an additional 20 m at room temperature (lanes 7–10): AhR ab, anti-AhR goat IgG (N-19); Arnt ab, anti-Arnt rabbit IgG (H172); goat IgG or rabbit IgG was negative controls. E. ChIP data showing the 3-methylcholanthrene (3MC)-mediated AhR recruitment at the cyp1a1 promoter of WT, NC, and p23kd1 cells. The images below are a representative of agarose gel images showing the amplified DRE region of the cyp1a1 promoter (214bp). 5% input represents the PCR product using 5% of the starting lysate as the template. This experiment was repeated three times with similar results. The error bars represent mean ± SD, n = 3.
Fig. 5
Fig. 5
AhR/Arnt/DRE complex formation in p23kd1 Hepa1c1c7 nuclear extracts. A, Western results showing the amount of AhR, Arnt, and p23 in gel shift nuclear extracts with or without 3-methylcholanthrene (3MC) treatment (top). Each lane contained 20 μg of protein. The plot below shows the AhR (left), Arnt (middle) and p23 (right) levels with error bars (mean ± SD, n = 3). The images above are a presentation of the triplicate data. B, Western results showing the levels of Arnt and p23 in gel shift nuclear extracts when the AhR levels after 3-methylcholanthrene (3MC) treatment were normalized among the WT, NC, p23kd1 gel shift nuclear extract. More protein was loaded for p23kd1 nuclear extracts (+/− 3-methylcholanthrene). The plots below show the p23 (left) and Arnt (right) levels with error bars (mean ± SD, n = 3). The images above are a presentation of the triplicate data. N-19 was used to detect AhR in A and B. C, gel shift results of nuclear extracts from cells either treated with 3-methylcholanthrene (3MC) or vehicle DMSO alone for 1 h before harvest. Lanes 2, 4, 6 contained normalized amount of AhR whereas lanes 1–4, 7 contained normalized amount of protein (5 μg). The upper arrow indicates the AhR/Arnt/DRE complex whereas the lower arrow indicates the free probe. The plot (right) shows the means with error bars (mean ± SD, n = 3). The gel shift image (left) is a presentation of the triplicate data. D, controls to validate the AhR/Arnt/DRE complex. Each lane contained 5 μg of protein. Lanes 1–4 and 5–10 were from two separate gels. Lanes 2–4, 6–10 were 3-methylcholanthrene (3MC)-treated WT gel shift nuclear extract whereas lanes 1 and 5 were DMSO-treated WT extract. DRE, 5 pmol (10X) of unlabelled DRE; mDRE, 5pmol (10X) of unlabelled mutated DRE. 6 μg (3 μl) of IgG was added to samples at the end for an additional 20 m at room temperature (lanes 7–10): AhR ab, anti-AhR goat IgG (N-19); Arnt ab, anti-Arnt rabbit IgG (H172); goat IgG or rabbit IgG was negative controls. E. ChIP data showing the 3-methylcholanthrene (3MC)-mediated AhR recruitment at the cyp1a1 promoter of WT, NC, and p23kd1 cells. The images below are a representative of agarose gel images showing the amplified DRE region of the cyp1a1 promoter (214bp). 5% input represents the PCR product using 5% of the starting lysate as the template. This experiment was repeated three times with similar results. The error bars represent mean ± SD, n = 3.
Fig. 6
Fig. 6
Effect of p23 on AhR transcription and protein stability in p23kd1 and p23kd5 cells. WT, wild type Hepa1c1c7; NC, negative control knockdown stable Hepa1c1c7; p23kd1 and p23kd5, p23-specific knockdown stable Hepa1c1c7. GAPDH was used for Western normalization. A. real-time qPCR results showing the amount of the AhR message after actinomycin-D treatment. Cells (5×10⁵) were treated with actinomycin-D (5 μg/ml) for 0–6 h. The β-actin message was used for normalization. The graph (left) shows the amount of AhR message right after cycloheximide treatment. The time-dependent amount of AhR message after cycloheximide treatment was plotted with zero time point arbitrarily set as one to focus on the degradation rate. The plots show the means with error bars (mean ± SD, n = 3). This experiment was repeated once with similar results. The slopes of the figure (right) are not statistically different. B, Western results showing the amount of AhR after cycloheximide treatment. Cells (5×10⁵) were treated with cycloheximide (50 μg/ml) for 0–6 h one day after seeding and then whole cell extract was obtained. Each lane contained 50 μg of protein. The amount at zero time point was arbitrarily set as one. The plot below shows the means with error bars (mean ± SD, n = 3). The images above are a presentation of the triplicate data. This experiment was repeated once with similar results. The slope of p23kd1 is significantly different. C, same as B except that p23kd5 was used instead of p23kd1. Treatment with cycloheximide (CHX) (50 μg/ml) alone (top) or cyclohexmide (50 μg/ml) and 10 μM MG132 (bottom) was up to 8 h. D, p23kd5 cells were treated for 6 h with either DMSO, 10 μM MG132, cyclohexmide (CHX) (50 μg/ml), or both. This Western was repeated two times and plotted (mean ± SD, n = 3). SA210 was used to detect AhR in B–D.
Fig. 6
Fig. 6
Effect of p23 on AhR transcription and protein stability in p23kd1 and p23kd5 cells. WT, wild type Hepa1c1c7; NC, negative control knockdown stable Hepa1c1c7; p23kd1 and p23kd5, p23-specific knockdown stable Hepa1c1c7. GAPDH was used for Western normalization. A. real-time qPCR results showing the amount of the AhR message after actinomycin-D treatment. Cells (5×10⁵) were treated with actinomycin-D (5 μg/ml) for 0–6 h. The β-actin message was used for normalization. The graph (left) shows the amount of AhR message right after cycloheximide treatment. The time-dependent amount of AhR message after cycloheximide treatment was plotted with zero time point arbitrarily set as one to focus on the degradation rate. The plots show the means with error bars (mean ± SD, n = 3). This experiment was repeated once with similar results. The slopes of the figure (right) are not statistically different. B, Western results showing the amount of AhR after cycloheximide treatment. Cells (5×10⁵) were treated with cycloheximide (50 μg/ml) for 0–6 h one day after seeding and then whole cell extract was obtained. Each lane contained 50 μg of protein. The amount at zero time point was arbitrarily set as one. The plot below shows the means with error bars (mean ± SD, n = 3). The images above are a presentation of the triplicate data. This experiment was repeated once with similar results. The slope of p23kd1 is significantly different. C, same as B except that p23kd5 was used instead of p23kd1. Treatment with cycloheximide (CHX) (50 μg/ml) alone (top) or cyclohexmide (50 μg/ml) and 10 μM MG132 (bottom) was up to 8 h. D, p23kd5 cells were treated for 6 h with either DMSO, 10 μM MG132, cyclohexmide (CHX) (50 μg/ml), or both. This Western was repeated two times and plotted (mean ± SD, n = 3). SA210 was used to detect AhR in B–D.
Fig. 7
Fig. 7
MG132 effect on 3-methylcholanthrene-induced AhR degradation in p23-specific knockdown stable Hepa1c1c7, Hep3B, and HeLa cells. SA210 was used to detect AhR. Wild type (WT), negative control knockdown stable (NC), and p23-specific knockdown stable p23kd5 Hepa1c1c7 (A), p23kd6 Hep3B (B, top) p23kd8 HeLa (B, bottom) were used. Cells were treated for 6 h with either DMSO, 1 μM 3-methylcholanthrene (3MC), 10 μM MG132, or both. Each lane contained 20 μg of whole cell extract. GAPDH was used for normalization. Western in A was repeated twice and plotted (mean ± SD, n = 3).
Fig. 7
Fig. 7
MG132 effect on 3-methylcholanthrene-induced AhR degradation in p23-specific knockdown stable Hepa1c1c7, Hep3B, and HeLa cells. SA210 was used to detect AhR. Wild type (WT), negative control knockdown stable (NC), and p23-specific knockdown stable p23kd5 Hepa1c1c7 (A), p23kd6 Hep3B (B, top) p23kd8 HeLa (B, bottom) were used. Cells were treated for 6 h with either DMSO, 1 μM 3-methylcholanthrene (3MC), 10 μM MG132, or both. Each lane contained 20 μg of whole cell extract. GAPDH was used for normalization. Western in A was repeated twice and plotted (mean ± SD, n = 3).

Similar articles

Cited by

References

    1. Smith DF, Faber LE, Toft DO. Purification of unactivated progesterone receptor and identification of novel receptor-associated proteins. J Biol Chem. 1990;265:3996–4003. - PubMed
    1. Johnson JL, Beito TG, Krco CJ, Toft DO. Characterization of a novel 23-kilodalton protein of unactive progesterone receptor complexes. Mol Cell Biol. 1994;14:1956–63. - PMC - PubMed
    1. Freeman BC, Felts SJ, Toft DO, Yamamoto KR. The p23 molecular chaperones act at a late step in intracellular receptor action to differentially affect ligand efficacies. Genes Dev. 2000;14:422–34. - PMC - PubMed
    1. Johnson JL, Toft DO. A novel chaperone complex for steroid receptors involving heat shock proteins, immunophilins, and p23. J Biol Chem. 1994;269:24989–93. - PubMed
    1. Johnson JL, Toft DO. Binding of p23 and hsp90 during assembly with the progesterone receptor. Mol Endocrinol. 1995;9:670–8. - PubMed

Publication types

MeSH terms

Substances