

In silico QTL mapping of maternal nurturing ability with the mouse diversity panel
- PMID: 22759921
- PMCID: PMC3774570
- DOI: 10.1152/physiolgenomics.00159.2011
In silico QTL mapping of maternal nurturing ability with the mouse diversity panel
Abstract
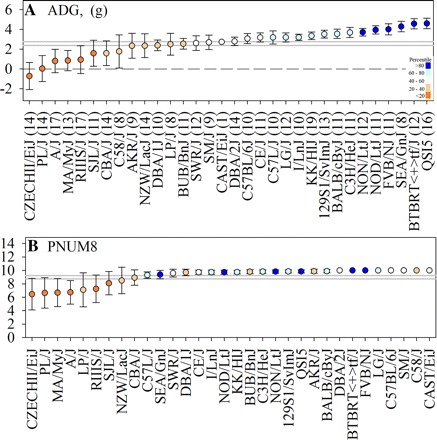
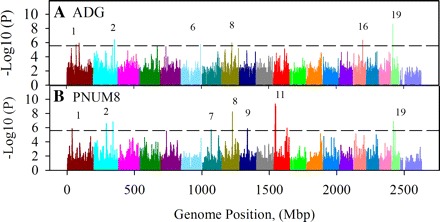
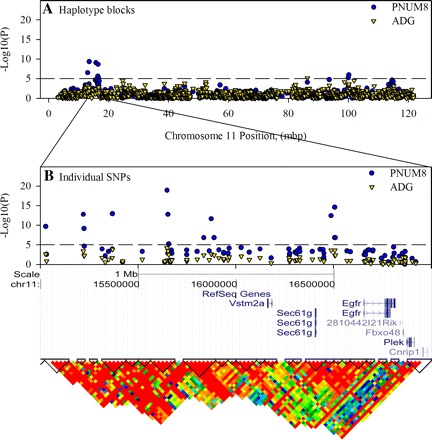
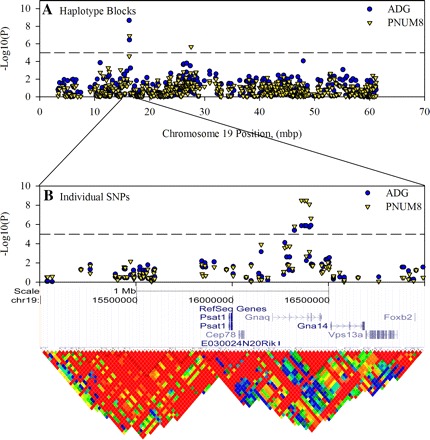
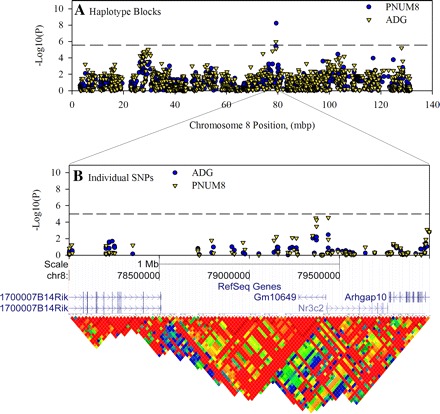
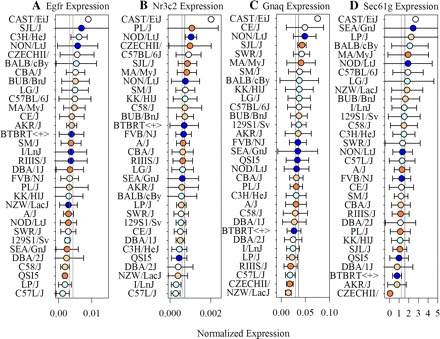
Significant variation exists for maternal nurturing ability in inbred mice. Although classical mapping approaches have identified quantitative trait loci (QTL) that may account for this variation, the underlying genes are unknown. In this study, lactation performance data among the mouse diversity panel were used to map genomic regions associated with this variation. Females from each of 32 inbred strains (n = 8-19 dams/strain) were studied during the first 8 days of lactation by allowing them to raise weight- and size-normalized cross-foster litters (10 pups/litter). Average daily weight gain (ADG) of litters served as the primary indicator of milk production. The number of pups successfully reared to 8 days (PNUM8) also served as a related indicator of maternal performance. Initial haplotype association analysis using a Bonferroni-corrected, genome-wide threshold revealed 10 and 15 associations encompassing 11 and 13 genes for ADG and PNUM8, respectively. The most significant of these associated haplotype blocks were found on MMU 8, 11, and 19 and contained the genes Nr3c2, Egfr, Sec61g, and Gnaq. Lastly, two haplotype blocks on MMU9 were detected in association with PNUM8. These overlapped with the previously described maternal performance QTL, Neogq1. These results suggest that the application of in silico QTL mapping is a useful tool in discovering the presence of novel candidate genes involved in determining lactation capacity in mice.
Figures
Similar articles
-
Combining mouse mammary gland gene expression and comparative mapping for the identification of candidate genes for QTL of milk production traits in cattle.BMC Genomics. 2007 Jun 20;8:183. doi: 10.1186/1471-2164-8-183. BMC Genomics. 2007. PMID: 17584498 Free PMC article.
-
An integrated genomics approach to identify genetic regions associated with neonatal growth trait in mice.Anim Biotechnol. 2014 Apr 3;25(2):85-97. doi: 10.1080/10495398.2013.814571. Anim Biotechnol. 2014. PMID: 24555794
-
In-silico QTL mapping of postpubertal mammary ductal development in the mouse uncovers potential human breast cancer risk loci.Mamm Genome. 2015 Feb;26(1-2):57-79. doi: 10.1007/s00335-014-9551-x. Epub 2015 Jan 1. Mamm Genome. 2015. PMID: 25552398 Free PMC article.
-
In silico QTL mapping of basal liver iron levels in inbred mouse strains.Physiol Genomics. 2011 Feb 11;43(3):136-47. doi: 10.1152/physiolgenomics.00025.2010. Epub 2010 Nov 9. Physiol Genomics. 2011. PMID: 21062905 Free PMC article.
-
Correlated responses in maternal performance following divergent selection for heat loss in mice.J Anim Sci. 2006 Feb;84(2):300-4. doi: 10.2527/2006.842300x. J Anim Sci. 2006. PMID: 16424256
Cited by
-
Cross-Species Meta-Analysis of Transcriptomic Data in Combination With Supervised Machine Learning Models Identifies the Common Gene Signature of Lactation Process.Front Genet. 2018 Jul 12;9:235. doi: 10.3389/fgene.2018.00235. eCollection 2018. Front Genet. 2018. PMID: 30050559 Free PMC article.
-
In silico mapping of quantitative trait loci (QTL) regulating the milk ionome in mice identifies a milk iron locus on chromosome 1.Mamm Genome. 2018 Oct;29(9-10):632-655. doi: 10.1007/s00335-018-9762-7. Epub 2018 Aug 2. Mamm Genome. 2018. PMID: 30073618
-
Transgenerational cardiology: One way to a baby's heart is through the mother.Mol Cell Endocrinol. 2016 Nov 5;435:94-102. doi: 10.1016/j.mce.2016.08.029. Epub 2016 Aug 20. Mol Cell Endocrinol. 2016. PMID: 27555292 Free PMC article. Review.
-
Mousepost 2.0, a major expansion of the resource.Nucleic Acids Res. 2023 Feb 28;51(4):1652-1661. doi: 10.1093/nar/gkad064. Nucleic Acids Res. 2023. PMID: 36762471 Free PMC article.
-
Genetic analysis of low survival rate of pups in RR/Sgn inbred mice.J Vet Med Sci. 2015 Jul;77(7):809-13. doi: 10.1292/jvms.14-0361. Epub 2015 Mar 5. J Vet Med Sci. 2015. PMID: 25754650 Free PMC article.
References
-
- Anderson RR, Turner CW. Aldosterone and corticosterone in maintenance of lactation in adrenalectomized rats. Proc Soc Exp Biol Med 112: 997–1000, 1963 - PubMed
-
- Ashwell MS, Van Tassell CP. Detection of putative loci affecting milk, health, and type traits in a US Holstein population using 70 microsatellite markers in a genome scan. J Dairy Sci 82: 2497–2502, 1999 - PubMed
-
- Barrett JC, Fry B, Maller J, Daly MJ. Haploview: analysis and visualization of LD and haplotype maps. Bioinformatics 21: 263–265, 2005 - PubMed
-
- Blott S, Kim JJ, Moisio S, Schmidt-Kuntzel A, Cornet A, Berzi P, Cambisano N, Ford C, Grisart B, Johnson D, Karim L, Simon P, Snell R, Spelman R, Wong J, Vilkki J, Georges M, Farnir F, Coppieters W. Molecular dissection of a quantitative trait locus: a phenylalanine-to-tyrosine substitution in the transmembrane domain of the bovine growth hormone receptor is associated with a major effect on milk yield and composition. Genetics 163: 253–266, 2003 - PMC - PubMed
-
- Bopp SE, Ramachandran V, Henson K, Luzader A, Lindstrom M, Spooner M, Steffy BM, Suzuki O, Janse C, Waters AP, Zhou Y, Wiltshire T, Winzeler EA. Genome wide analysis of inbred mouse lines identifies a locus containing Ppar-gamma as contributing to enhanced malaria survival. PloS One 5: e10903, 2010 - PMC - PubMed
Publication types
MeSH terms
Substances
Grants and funding
LinkOut - more resources
Full Text Sources
Molecular Biology Databases
Research Materials
Miscellaneous