. 2012;30(1):33-48.
doi: 10.1159/000339047. Epub 2012 Jun 8.

Inhibition of Na(+)-K(+)-2Cl(-) cotransporter isoform 1 accelerates temozolomide-mediated apoptosis in glioblastoma cancer cells

Affiliations

Inhibition of Na(+)-K(+)-2Cl(-) cotransporter isoform 1 accelerates temozolomide-mediated apoptosis in glioblastoma cancer cells

Jehad Algharabil et al. Cell Physiol Biochem. 2012.

Abstract

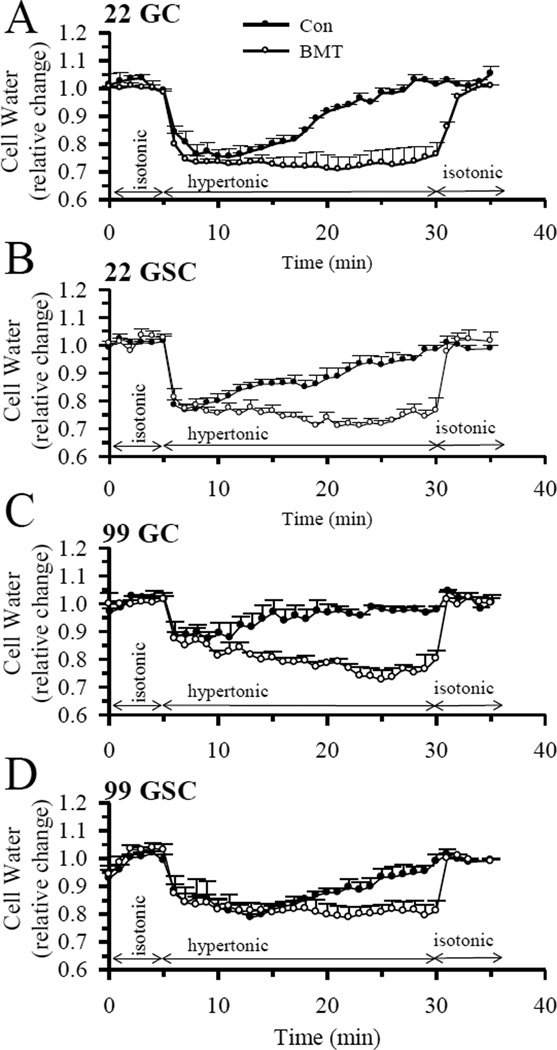
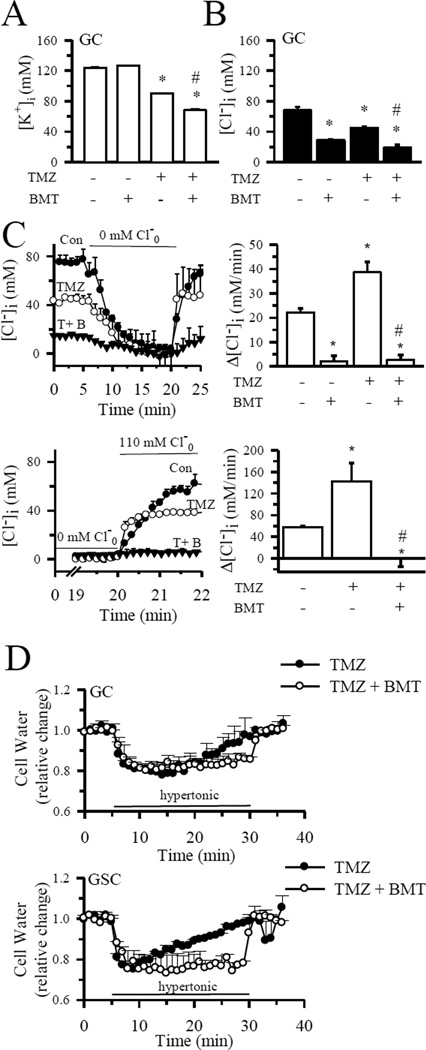
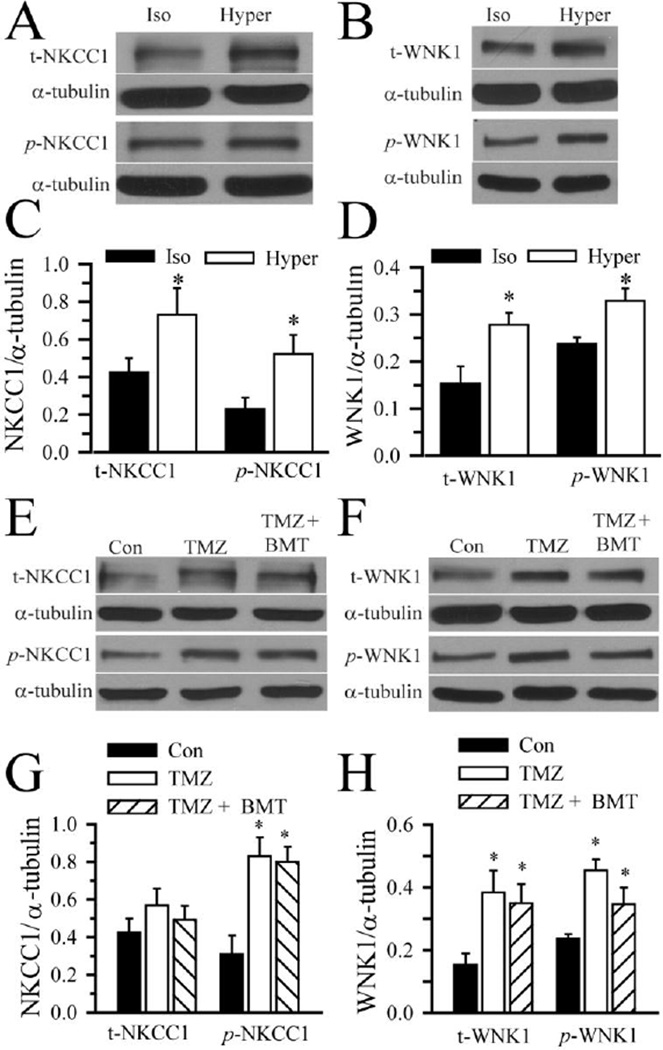
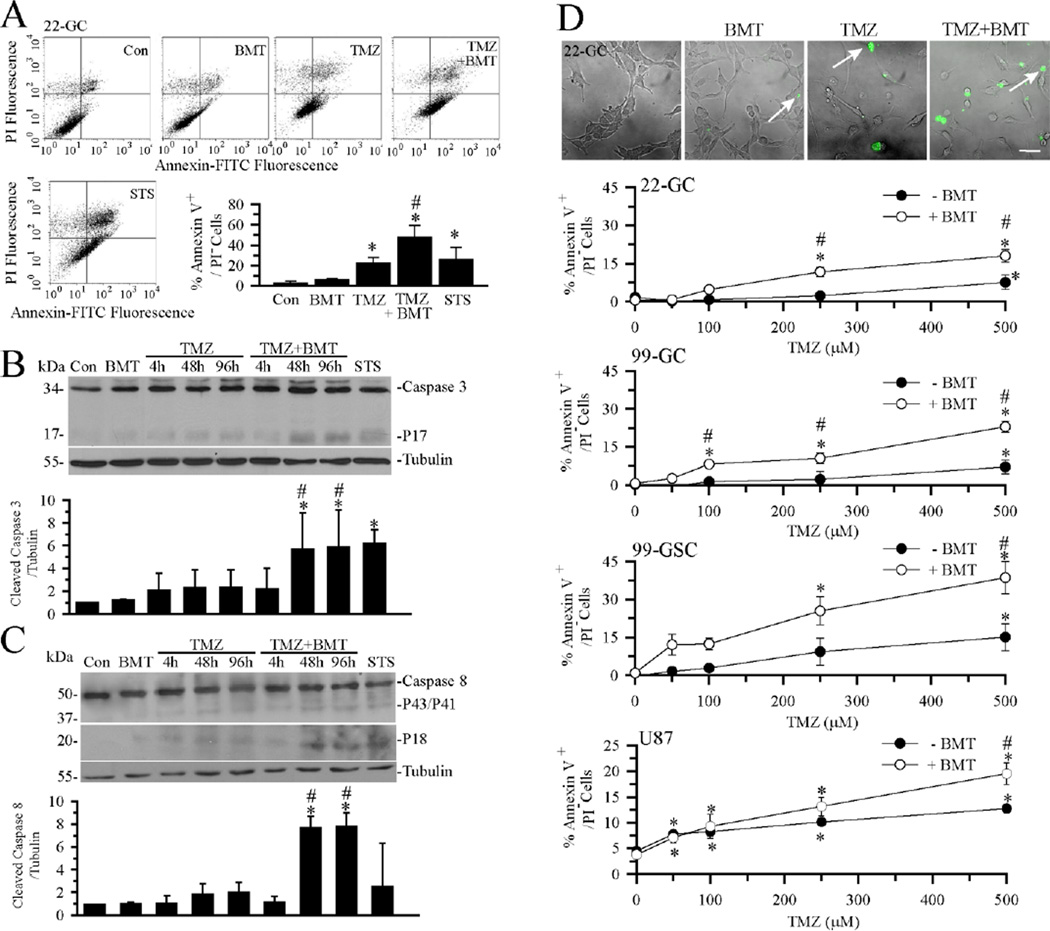
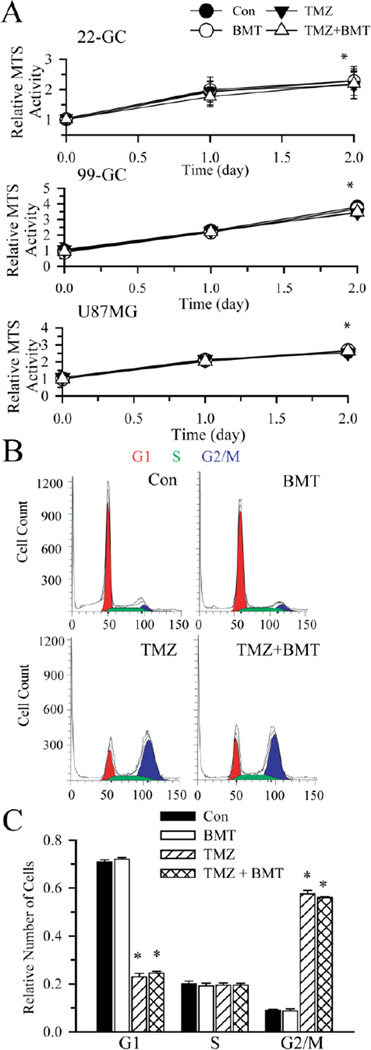
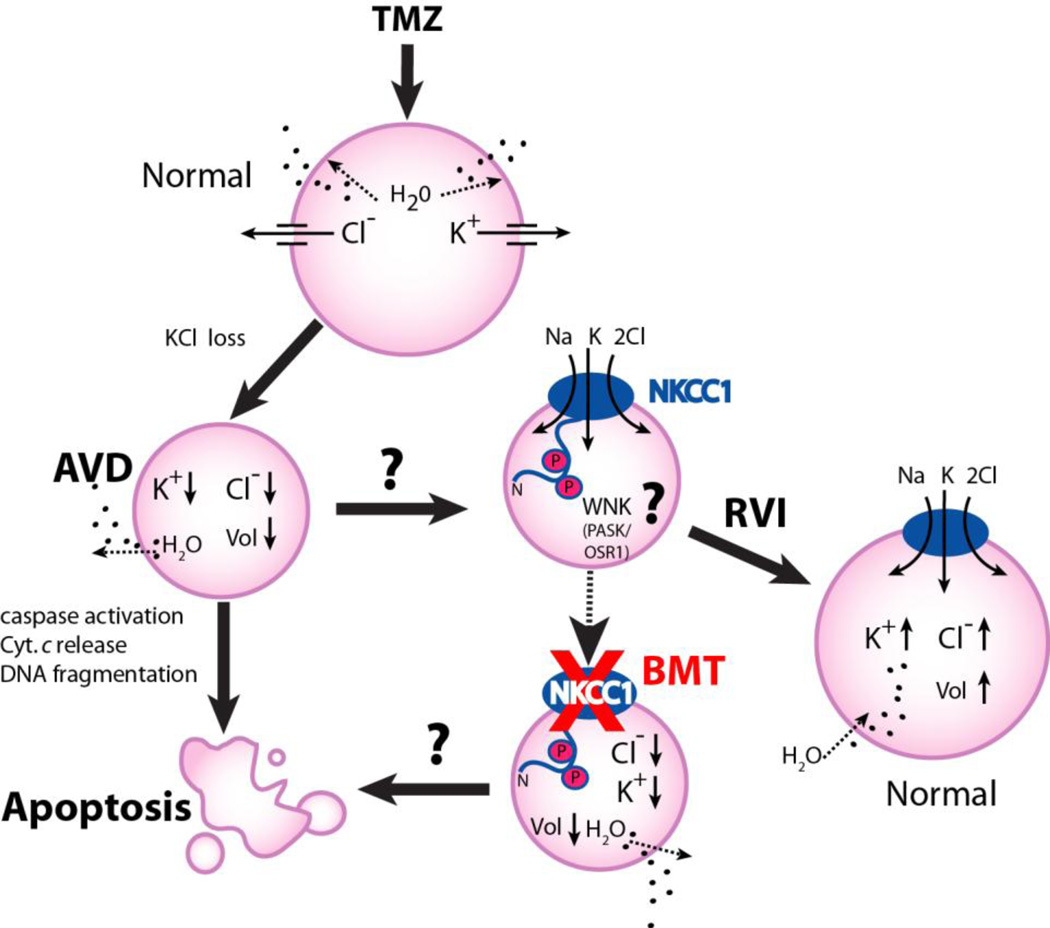
The hallmark of apoptosis is a significant reduction in cell volume (AVD) resulting from loss of K(+)(i) and Cl(-)(i). Loss of cell volume and lowering of ionic strength of intracellular K(+) and Cl(-) occur before any other detectable characteristics of apoptosis. In the present study, temozolomide (TMZ) triggered loss of K(+)(i) and Cl(-)(i) and AVD in primary glioblastoma multiforme (GBM) cancer cells (GC) and GC cancer stem cells (GSC). We hypothesize that Na(+)-K(+)-2Cl(-) cotransporter isoform 1 (NKCC1) counteracts AVD during apoptosis in GBM cancer cells by regulating cell volume and Cl(-) homeostasis. NKCC1 protein was expressed in both GC and GSC and played an essential role in regulatory volume increase (RVI) in response to hypertonic cell shrinkage and isotonic cell shrinkage. Blocking NKCC1 activity with its potent inhibitor bumetanide abolished RVI. These cells maintained a basal [Cl(-)](i) (~ 68 mM) above the electrochemical equilibrium for Cl(-)(i). NKCC1 also functioned to replenish Cl(-)(i) levels following the loss of Cl(-)(i). TMZ-treated cells exhibited increased phosphorylation of NKCC1 and its up-stream novel Cl(-)/volume-sensitive regulatory kinase WNK1. Inhibition of NKCC1 activity with bumetanide accelerated AVD, early apoptosis, as well as activation of caspase-3 and caspase-8. Taken together, this study strongly suggests that NKCC1 is an essential mechanism in GBM cells to maintain K(+), Cl(-), and volume homeostasis to counteract TMZ-induced loss of K(+), Cl(-) and AVD. Therefore, blocking NKCC1 function augments TMZ-induced apoptosis in glioma cells.


Figures

Figure 1
Figure 1. NKCC1-mediated regulatory volume increase (RVI)
The fluorescent dye calcein was used to measure cell water content and relative cell volume as described in Methods. Cells were exposed to isotonic HEPES-MEM (310 mOsm, 5 min), hypertonic HEPES-MEM (370 mOsm, 25 min), and isotonic HEPES-MEM (5 min). In the BMT studies, 10 µM BMT was added 30 min prior to the isotonic exposure. A. GC (#22). B. GSC (#22). C. GC (#99). D. GSC (#99). Data are means ± SEM. n = 4–7.
Figure 2
Figure 2. Inhibition of NKCC1 activity accelerates TMZ-induced loss of K+i and Cli
A. [K+]i in GC (#22) was determined using the fluorescent probe PBFI following 4 h of treatment with control medium, 10 µM BMT, 100 µM TMZ or TMZ plus 10 µM BMT. Data are means ± SEM, n = 3. * p < 0.05 vs. Con, # p < 0.05 vs. TMZ. B. [Cl]i in GC (#22) exposed to control medium, 10 µM BMT, 100 µM TMZ, or TMZ plus 10 µM BMT. Data are means ± SEM, n = 3–6. * p < 0.05 vs. Con, # p < 0.05 vs. TMZ. C. Upper left panel: Changes of [Cl]i in GC in normal isotonic buffer, followed by exposure to 0 mM Cl for 15 min and subsequent exposure to normal isotonic buffer. Images were acquired every 1 min. Upper right panel: Summary data of the NKCC1-mediated Cli replenishment rate following 0 mM Cl exposure were shown. Slopes were calculated between 0 and 1 min of Cli replenishment. Lower left panel: Experimental protocol was identical to upper panel. Images were collected every 10 sec beginning at 14 min of 0 mM Cl exposure. Cells were either treated with 100 µM TMZ or 100 µM TMZ and 10 µM BMT for 4 h. Lower right panel: Summary data of Cli replenishment slopes that were calculated between 0 and 10 sec of Cli replenishment. Drugs were present for the entire experiment. Data are means ± SEM, n = 3–6. * p < 0.05 vs. Con, # p < 0.05 vs. TMZ. D. NKCC1-mediated RVI remains active in TMZ treatment. RVI was determined in either GC (#22) or GSC (#22) after 4 h of treatment with 100 µM TMZ or TMZ plus 10 µM BMT. Data are means ± SEM. n = 3.
Figure 3
Figure 3. Blocking NKCC1 activity accelerates AVD after TMZ treatment
A. Time-lapse DIC images were used to measure changes in cell volume in GSC (#22). Cultures were treated with TMZ (500 µM) or TMZ + BMT (10 µM) and representative images of cells at times 0, 4, 8, and 12 h are shown. Inhibition of NKCC1 with BMT accelerated AVD, as evident by the loss of processes, and cell body shrinkage (arrowhead). B. Summary data of relative cell volume changes. Data are means ± SEM. n = 8–9. * p < 0.05 vs. corresponding TMZ. C. GC (#22) were exposed to normal medium (Con), Con + 10 µM BMT, 500 µM TMZ, 500 µM TMZ + 10 µM BMT or 4 µM STS for 4 h. Cell size was examined by flow cytometry using a FSC versus SSC 3D plot. 4 µM STS-treated GC were used as a positive control for AVD. Red circle: shrunken population of cells in the 3D plots. Data are means ± SD. n = 3. * p < 0.05. vs. Con.
Figure 4
Figure 4. Activation of NKCC1 and WNK1 following osmotic stress and TMZ treatment
A–D. GC (#22) were exposed to isotonic (310 mOsm) or hypertonic HEPES-MEM (370 mOsm) for 25 min. Expression of total NKCC1, total WNK1, phosphorylated NKCC1 (p-NKCC1), and phosphorylated WNK1 (p-WNK1) were evaluated by immunoblotting. A, B. Representative immunoblots showing expression of t-NKCC1, p-NKCC1, t-WNK1 and p-WNK1 protein under isotonic and hypertonic conditions. C, D. Summary data of immunoblotting. NKCC1/α-tubulin ratio (either t-NKCC1 or p-NKCC1) and WNK1/α-tubulin ratio (either t-WNK1 or p-WNK1) were calculated. Data are mean ± SD, n = 3–4, * p < 0.05 vs. Iso. E–H. GC (#22) were exposed to isotonic medium (Con), 100 µM TMZ, or TMZ plus 10 µM BMT for 4 h. Expression of t-NKCC1, t-WNK1, p-NKCC1, and p-WNK1 were evaluated by immunoblotting. E, F. Representative immunoblots. The pWNK1 control sample in F is the same isotonic control sample in panel B. G, H. Summary data of immunoblotting. NKCC1/α-tubulin ratio (either t-NKCC1 or p-NKCC1) and WNK1/α-tubulin ratio (either t-WNK1 or p-WNK1) were calculated. Data are mean ± SD. n = 3–4, * p < 0.05 vs. Con.
Figure 5
Figure 5. Blocking NKCC1 activity enhances TMZ-mediated apoptosis
A. Apoptosis in GC (#22) was assessed by Annexin-V vs. PI staining in flow cytometry. GC were exposed to normal medium (Con), Con + 10 µM BMT, 500 µM TMZ, 500 µM TMZ + 10 µM BMT or 4 µM STS for 4 h. Representative dot-plots show viable cells (lower left quadrant), early apoptotic cells (lower right quadrant), and late apoptotic or necrotic cells (upper right quadrant). Bottom right hand panel: Summary data of cells with Annexin-V positive and PI-negative staining. Data are means ± SD, n = 3. * p < 0.05 vs. Con. # p < 0.05 vs. TMZ. B, C. Representative immunoblots and summary data of activated caspase-3 and caspase-8 in GC (#22) following exposure to normal medium (Con), Con + 10 µM BMT, 100 µM TMZ, 500 µM TMZ + 10 µM BMT or 4 µM STS for 4 h. Data are means ± SD, n = 3. * p < 0.05 vs. Con. # p < 0.05 vs. correspondent 100 µM TMZ. D. BMT sensitized GC and GSC to TMZ-induced phosphatidylserine externalization. Top panel: Early apoptotic cells (GC #22) are revealed by FITC-conjugated Annexin staining (arrow) under conditions of Con, Con + 10 µM BMT, 500 µM TMZ, or 500 µM TMZ + 10 µM BMT for 48 h. Scale bar = 50 µM. Lower panels: Summary data of TMZ dose-response curves at 48 h in GC (#22), GC (#99), GSC (#99), or U87MG. Data are means ± SEM. n = 3–6. * p < 0.05 vs. 0 mM TMZ, # p < 0.05 vs. corresponding BMT.
Figure 6
Figure 6. Cell proliferation and cell cycle arrest in the presence of TMZ
A. Graphs of relative MTS activity in cells under each condition. Data are means ± SD. n = 3. * p < 0.05 vs. Con. B. Flow cytometric analysis of cell cycle distribution of GC (#22) cells treated with vehicle (DMSO), 10 µM BMT, 250 µM TMZ, 250 µM TMZ + 10 µM BMT for 96 h. The G1(red), S (Green), and G2/M (blue) phases are indicated. C. A summary graph of percent GC cells in each phase of cell cycle. Data are means ± SEM. n = 3. * p < 0.05 vs. Con.
Figure 7
Figure 7. A schematic model of NKCC1 in TMZ-mediated apoptosis
TMZ triggers loss of K+i, Cli and apoptotic volume decrease (AVD), and leads to apoptotic cell death in glioblastoma cancer cells. NKCC1 activity may be stimulated via the novel Cl/volume-sensitive regulatory kinases WNK-mediated signaling transduction pathway in response to TMZ. Activation of NKCC1 in TMZ-treated cells accumulate Na+i, K+i, and Cli and obligated water molecules (regulatory volume increase, RVI) to counteract ionic dysregulation and AVD and promote cell survival. Inhibition of NKCC1 activity with BMT would facilitate loss of K+i, Cli and AVD, thus augments glioma cells to TMZ-mediated apoptosis.

References

    1. Louis DN. Molecular pathology of malignant gliomas. Annu Rev Pathol. 2006;1:97–117. - PubMed
    1. Denysenko T, Gennero L, Roos MA, Melcarne A, Juenemann C, Faccani G, Morra I, Cavallo G, Reguzzi S, Pescarmona G, Ponzetto A. Glioblastoma cancer stem cells: heterogeneity, microenvironment and related therapeutic strategies. Cell Biochem Funct. 2010;28:343–351. - PubMed
    1. Dirks PB. Brain tumor stem cells: the cancer stem cell hypothesis writ large. Mol Oncol. 2010;4:420–430. - PMC - PubMed
    1. Stupp R, Mason WP, van den Bent MJ, Weller M, Fisher B, Taphoorn MJ, Belanger K, Brandes AA, Marosi C, Bogdahn U, Curschmann J, Janzer RC, Ludwin SK, Gorlia T, Allgeier A, Lacombe D, Cairncross JG, Eisenhauer E, Mirimanoff RO. Radiotherapy plus concomitant and adjuvant temozolomide for glioblastoma. N Engl J Med. 2005;352:987–996. - PubMed
    1. Liu G, Yuan X, Zeng Z, Tunici P, Ng H, Abdulkadir IR, Lu L, Irvin D, Black KL, Yu JS. Analysis of gene expression and chemoresistance of CD133+ cancer stem cells in glioblastoma. Mol Cancer. 2006;5:67. - PMC - PubMed

Publication types

MeSH terms