. 2012 Jul 3:3:929.
doi: 10.1038/ncomms1928.

In silico method for modelling metabolism and gene product expression at genome scale

Affiliations

In silico method for modelling metabolism and gene product expression at genome scale

Joshua A Lerman et al. Nat Commun. .

Abstract

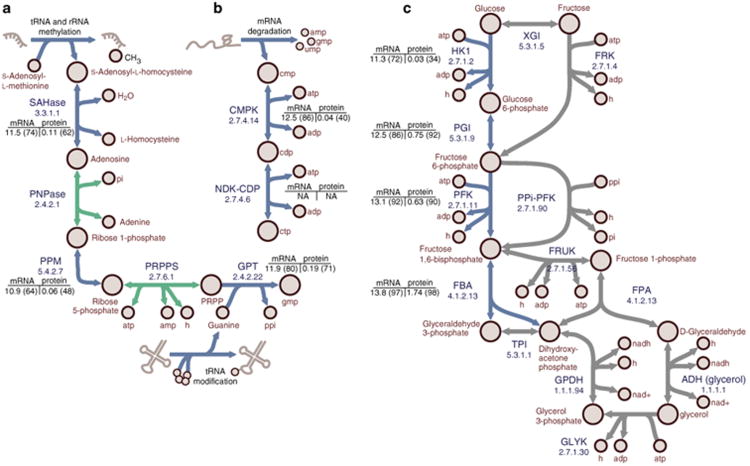
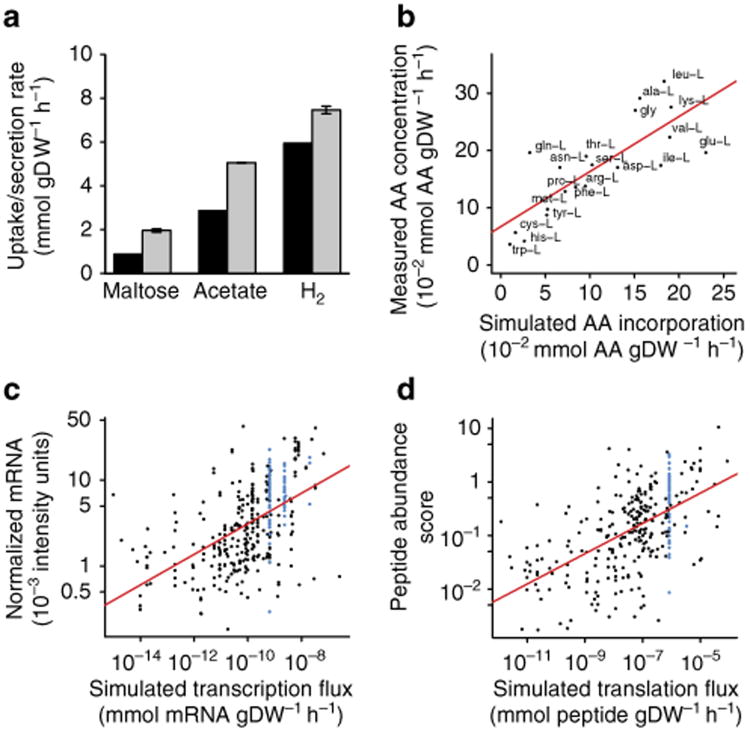
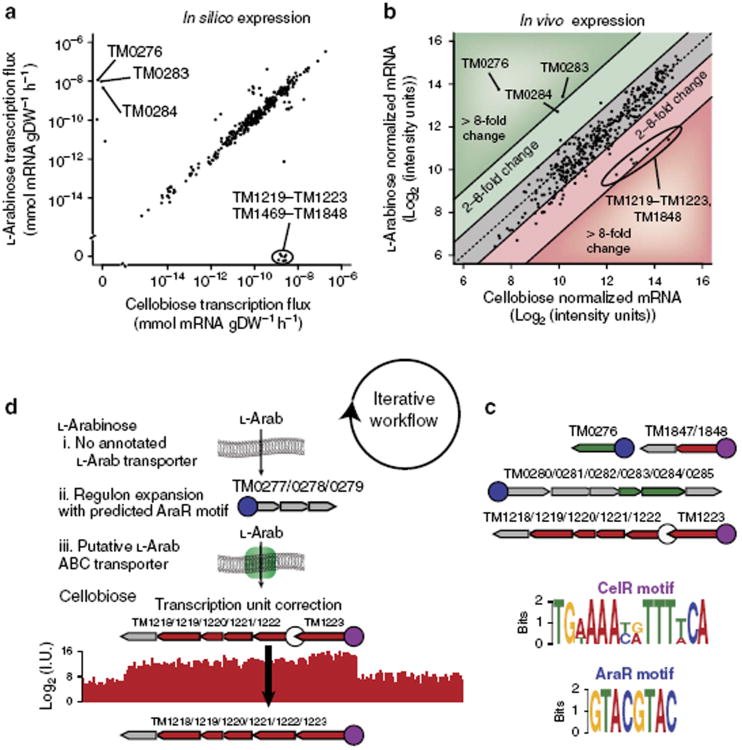
Transcription and translation use raw materials and energy generated metabolically to create the macromolecular machinery responsible for all cellular functions, including metabolism. A biochemically accurate model of molecular biology and metabolism will facilitate comprehensive and quantitative computations of an organism's molecular constitution as a function of genetic and environmental parameters. Here we formulate a model of metabolism and macromolecular expression. Prototyping it using the simple microorganism Thermotoga maritima, we show our model accurately simulates variations in cellular composition and gene expression. Moreover, through in silico comparative transcriptomics, the model allows the discovery of new regulons and improving the genome and transcription unit annotations. Our method presents a framework for investigating molecular biology and cellular physiology in silico and may allow quantitative interpretation of multi-omics data sets in the context of an integrated biochemical description of an organism.


Figures

Figure 1
Figure 1. Genome-scale modelling of metabolism and expression
(a) Modern stoichiometric models of metabolism (M-Models) relate genetic loci to their encoded functions through causal Boolean relationships. The gene and its functions are either present or absent. The dashed arrow signifies incomplete and/or uncertain causal knowledge, whereas blue arrows signify mechanistic coverage. (b) ME-Models provide links between the biological sciences. With an integrated model of metabolism and macromolecular expression, it is possible to explore the relationships between gene products, genetic perturbations and gene functions in the context of cellular physiology. (c) models of metabolism and expression (ME-Models) explicitly account for the genotype–phenotype relationship with biochemical representations of transcriptional and translational processes. This facilitates quantitative modelling of the relation between genome content, gene expression and cellular physiology. (d) When simulating cellular physiology, the transcriptional, translational and enzymatic activities are coupled to doubling time (Td) using constraints that limit transcription and translation rates as well as enzyme efficiency. τmRnA, mRnA half-life; kcat, catalytic turnover constant; ktranslation, translation rate; ν, reaction flux.
Figure 2
Figure 2. Comparison of M- and ME-Models objective functions and assumptions
(a) M-Models simulate constant cellular composition (biomass) as a function of specific growth rate (μ), whereas ME-Models simulate constant structural composition with variable composition of proteins and transcripts. (b) Linear programming simulations with M-Models are designed to identify the maximum μ that is subject to experimentally measured substrate uptake rates. only biomass yields are predicted as μ enters indirectly as an input through the supplied substrate uptake rate (see the measurement column for M-Models). Importantly, the substrate uptake rate is derived by normalizing to biomass production. Linear programming simulations with ME-Models aim to identify the minimum ribosome production rate required to support an experimentally determined μ. μ enters into the coupling constraints and so it must be supplied (or sampled) as the problem would otherwise be a nonlinear Program (nLP). As all M-Models reactions are contained within the ME-Models, ME-Models can simulate all M-Models objectives in addition to the broad range of objectives associated with macromolecular expression.
Figure 3
Figure 3. Simulation of variable cellular composition and efficient use of enzymes
(a) With our ME-Model, the RnA/protein ratio increases linearly with growth rate and with a slope proportional to translational capacity in amino acids per second (circles: 5 AA/s, squares: 10 AA/s, triangles: 20 AA/s). (b) Ribosomal RNA (rRnA) synthesis increases, relative to total RNA synthesis, with growth rate (symbols as in a). (c) Ribosomal protein promoter activity increases, relative to total RNA synthesis, with growth rate (symbols as in a). (d) Random sampling of the M-Model solution space indicates that the M-Model solution space contains numerous internal solutions with a broad range of total network flux. The probability of finding an M-Model solution as efficient as an ME-Model simulation is 2.1 × 10⁻⁵; the probability was calculated from a normal distribution constructed from the M-Model sample space. The M-Model sample contains 5,000 flux vectors randomly sampled from the M-Model solution space. (e) smooth estimate of the density of the flux ranges for the metabolic enzymes that may be simulated while maintaining the objective for efficient growth with a 1% tolerance (M-Model: red line, ME-Model: blue line). The shaded area denotes biologically unrealistic flux values. All simulations were performed with an in silico minimal medium with maltose as the sole carbon source.
Figure 4
Figure 4. Metabolic reactions required for efficient growth with the ME-Model but not the M-Model
(a) Recycling of by-products of RNA modifications. Adenosylhomocysteinease (SAHase) hydrolyses S-adenosylhomocysteine (SAH) to L-homocysteine (L-HCys) and adenosine. Purine nucleoside phosphorylase (PNP) phosphorylases adenosine to adenine and ribose-1-phosphate (Rib-1-P). Rib-1-P is converted to ribose-5-phosphate (Rib-5-P) by phosphopentomutase (PPm). Phosphoribosylpyrophosphate synthetase (PRPPs) phosphorylates Rib-5-P to produce 5-phosphoribosol-1-pyrophosphate (PRPP). Guanine phosphoribosyltransferase (GPT) produces GMP from the reaction of PRPP and guanine, which is a by-product of tRnA metabolism. (b) CmP produced during mRnA degradation is recycled to CTP using cytidylate kinase (CMPK) and nucleoside-diphosphate kinase (NDK-CDP). (c) The ME-Model uses the canonical glycolytic pathway, whereas with the M-Model can circumvent portions during optimal growth simulations. The canonical pathway involves phosphorylation of D-glucose (D-Glc) to glucose-6-phospate (G6P) by hexokinase (HK1). G6P is isomerized to fructose-6-phosphate (F6P) by phosphoglucose isomerase (PGI). F6P is phosphorylated to fructose-1,6-bisphosphate (FBP) by phosphofructokinase (PFK). FBP is metabolized to glyceraldehyde-3-phosphate (G3P) and dihydroxyacetone phosphate (DHAP) by FBP aldolase (FBA). The M-Model can circumvent the HK1/PGI portion with glucose/xylose isomerase (GXI) and fructokinase (FRK); however, HK1 or PGI must also be expressed because G6P is an essential metabolite. PFK can be circumvented by diphosphate-fructose-6-phosphate 1-phosphotransferase (PPi-PFK). FBA can be circumvented by a pathway using 1-phosphofructokinase (FRUK), fructose-1-phosphate aldolase (FPA), alcohol dehydrogenase (ADH(glycerol)), glycerol kinase (GLYK), glycerol-3-phosphate dehydrogenase (GPDH) and triose phosphate isomerase (TPI). Enzyme commission numbers are provided for each reaction. mRNA and protein expression (and quantile) values are provided. Flux variability analysis was performed for simulated growth on maltose minimal medium. Blue arrows: reactions required for optimally efficient growth with the ME-Model, but not the M-Model. Green arrows: active reactions in a single maltose minimal medium simulation shown to put results into pathway context. Grey arrows: alternate optimal pathways in the M-Model.
Figure 5
Figure 5. The ME-Model accurately simulates molecular phenotypes during log-phase growth
(a) The ME-Model accurately simulates H2 and acetate secretion with maltose uptake when constrained with a measured growth rate (n = 2). Experiment: grey bars, simulation: black bars. (b) The in silico ribosome incorporates the 20 amino acids at rates proportional (Pearson correlation coefficient = 0.79; P < 4.1 × 10⁻⁵ t-test) to the bulk amino-acid composition of a T. maritima cell as measured by high-performance liquid chromatography (n = 1). (c) simulated transcriptome fluxes are significantly (P < 2.2 × 10⁻¹⁶ t-test) and positively correlated (Pearson correlation coefficient = 0.54) with semiquantitative in vivo transcriptome measurements (n = 4). RnAs containing ribosomal proteins (blue) were expressed stoichiometrically in simulations but exhibited variability in measurements. (d) simulated translation fluxes are significantly (P < 2.2 × 10⁻¹⁶ t-test) and positively correlated (Pearson correlation coefficient = 0.57) with semiquantitative in vivo proteomic measurements (n = 3). Ribosomal proteins (blue) were expressed stoichiometrically in simulations but exhibited variability in measurements.
Figure 6
Figure 6. In silico transcriptome profiling drives biological discovery
(a)In silico comparative transcriptomics identifies sets of genes that are differentially regulated for growth in L-arabinose (L-Arab) versus growth in cellobiose minimal media. Tm0276, Tm0283 and Tm0284 are essential for metabolizing l-Arab, whereas TM1219–TM1223, TM1469 and TM1848 are essential for metabolizing cellobiose. (b)In vivo transcriptome measurements (n = 2) confirm the in silico transcriptomics predictions for differential expression of genes when metabolizing l-Arab or cellobiose. (c) Two distinct putative TF-binding motifs are present upstream of the TUs containing genes differentially expressed in silico when simulating growth in l-Arab versus cellobiose minimal media. The motif upstream of the genes upregulated during growth in l-Arab medium is termed AraR, whereas the motif of the genes upregulated during growth in cellobiose medium is termed CelR. Genes (grey: not in the model, green: upregulated by l-arabinose, red: upregulated by cellobiose) organized into TUs involved in the shift are shown. Each TU contains a promoter region (circle) arbitrarily taken to be 75 base pairs upstream of the first gene in the TU. Promoters found to contain the AraR or CelR motifs are coloured blue and purple, respectively. (d) searching T. maritima's genome for additional AraR and CelR motifs results in new biological knowledge. Although T. maritima can metabolize l-Arab, there is no annotated transporter in the current genome. We identified a putative AraR motif in a single TU (Tm0277/0278/0279) not contained in the ME-Model. Analysis of the Tm0277/0278/0279 TU with the SEED RAST server indicated that the genes are likely components of an ABC transporter that may be associated with l-Arab transport. The CelR motif was not present in the promoter region upstream of the cellobiose transporter operon (Tm1218/1219/1220/1221/1222); however, the CelR motif was present in the promoter of the TU (TM1223) directly upstream of the cellobiose transport operon. Examination of the in vivo transcriptome measurement indicates that the cellobiose transporter operon belongs to the same TU as that of TM1223.

References

    1. Brenner S. Sequences and consequences. Philos Trans R Soc Lond B Biol Sci. 2010;365:207–212. - PMC - PubMed
    1. Otero JM, Nielsen J. Industrial systems biology. Biotechnol Bioeng. 2010;105:439–460. - PubMed
    1. Palsson B, Zengler K. The challenges of integrating multi-omic data sets. Nat Chem Biol. 2010;6:787–789. - PubMed
    1. Mahadevan R, Palsson BO, Lovley DR. In situ to in silico and back: elucidating the physiology and ecology of Geobacter spp. using genome-scale modelling. Nat Rev Microbiol. 2011;9:39–50. - PubMed
    1. Feist AM, Palsson BO. The growing scope of applications of genome-scale metabolic reconstructions using Escherichia coli. Nat Biotechnol. 2008;26:659–667. - PMC - PubMed

Publication types

MeSH terms

Associated data