. 2012 Jul 27;53(8):5016-28.
doi: 10.1167/iovs.11-8311.

Effects of proinflammatory cytokines on the claudin-19 rich tight junctions of human retinal pigment epithelium

Affiliations

Effects of proinflammatory cytokines on the claudin-19 rich tight junctions of human retinal pigment epithelium

Shaomin Peng et al. Invest Ophthalmol Vis Sci. .

Abstract

Purpose: Chronic, subclinical inflammation contributes to the pathogenesis of several ocular diseases, including age-related macular degeneration. Proinflammatory cytokines affect tight junctions in epithelia that lack claudin-19, but in the retinal pigment epithelium claudin-19 predominates. We examined the effects of cytokines on the tight junctions of human fetal RPE (hfRPE).

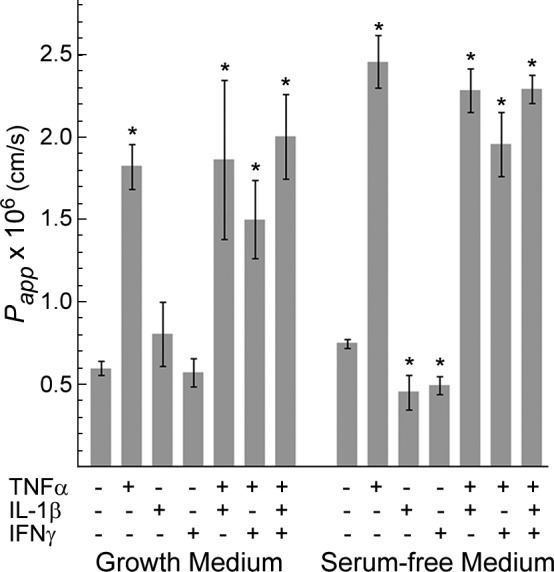
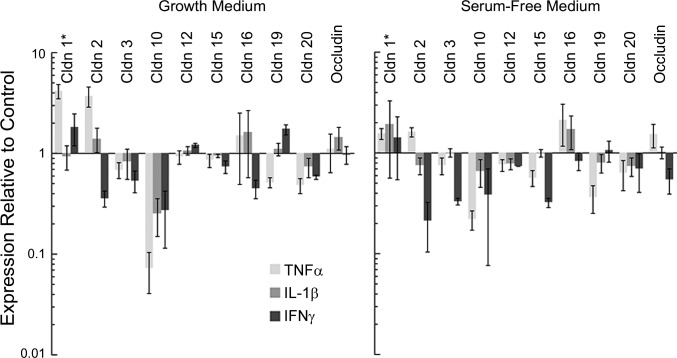
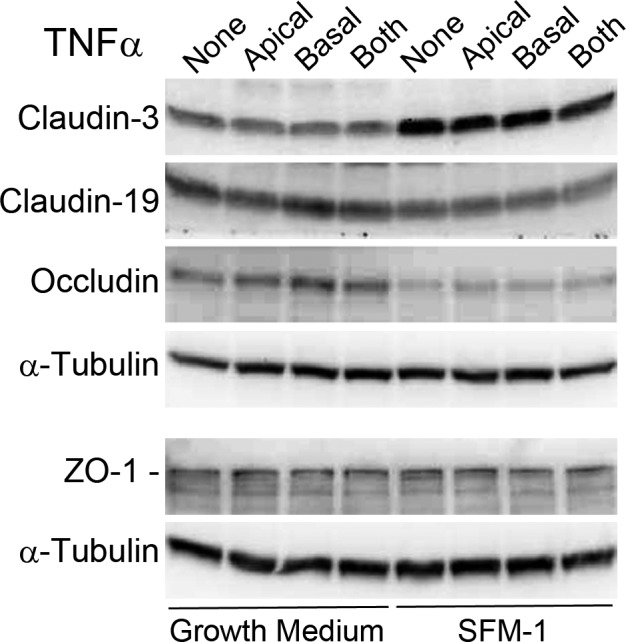
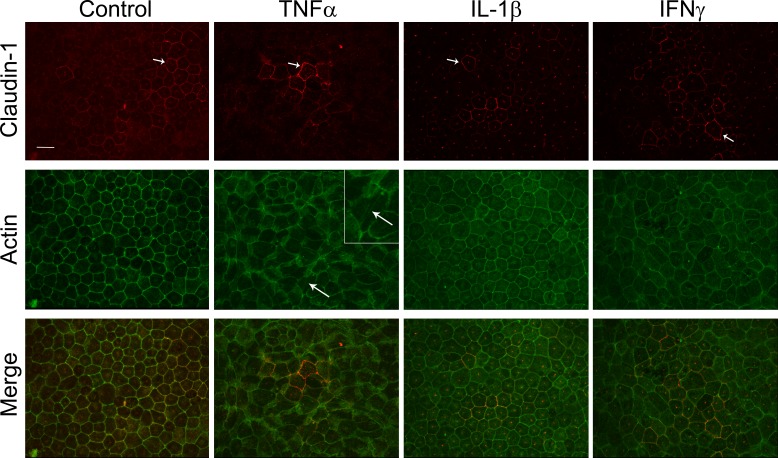
Methods: hfRPE was incubated with interleukin 1-beta (IL-1β), interferon-gamma (IFNγ), or tumor necrosis factor-alpha (TNFα), alone or in combination. Permeability and selectivity of the tight junctions were assessed using nonionic tracers and electrophysiology. Claudins, occludin, and ZO-1 were examined using PCR, immunoblotting, and confocal immunofluorescence microscopy.

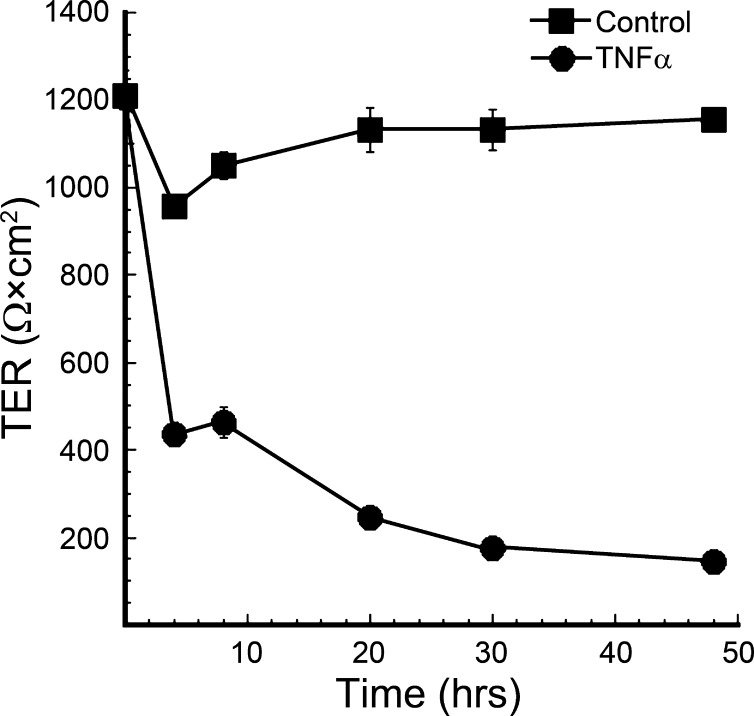
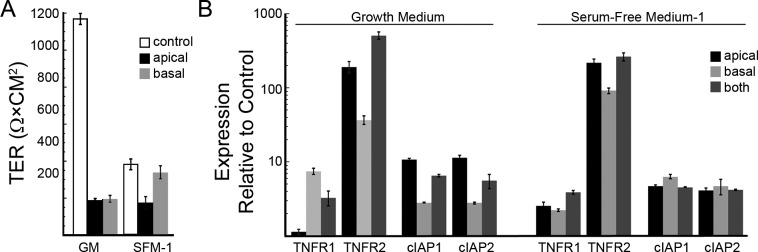
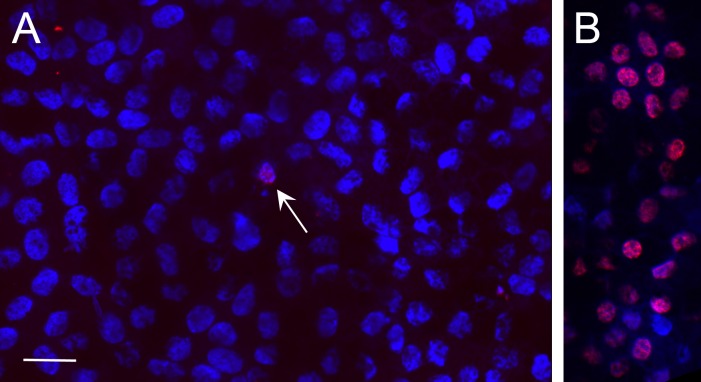
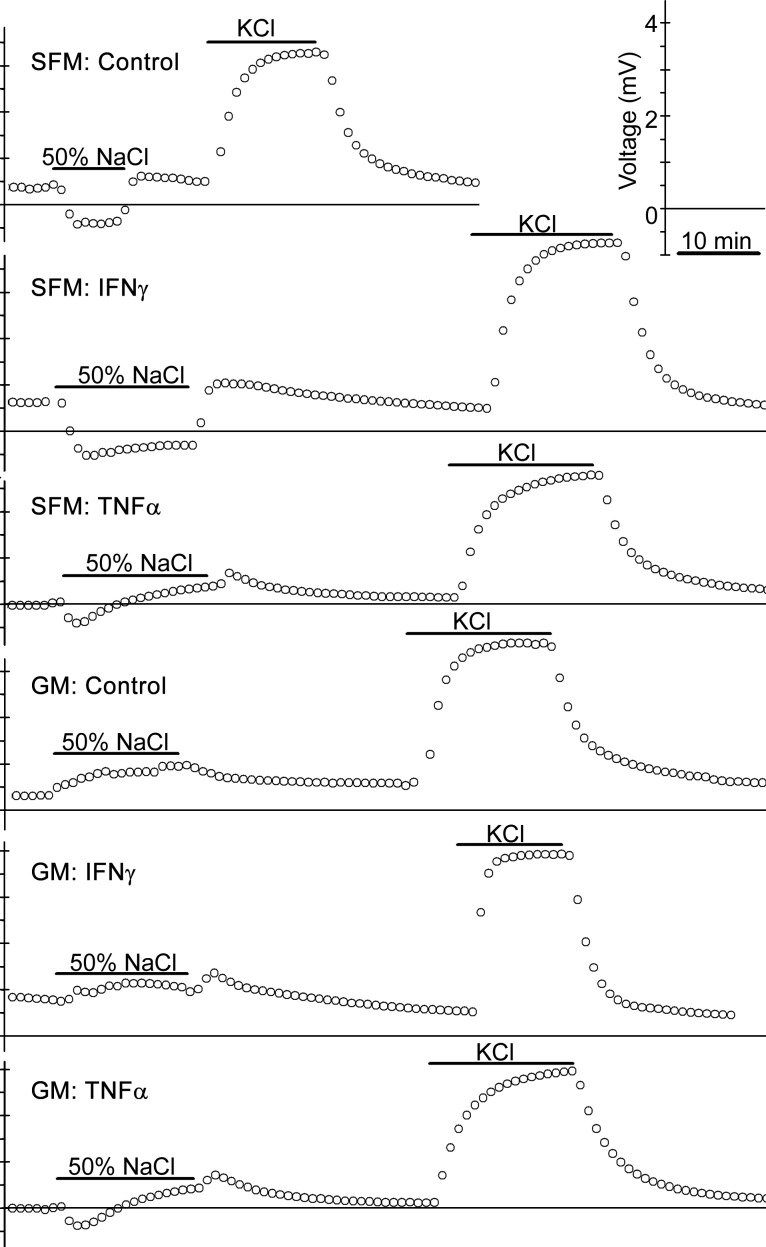
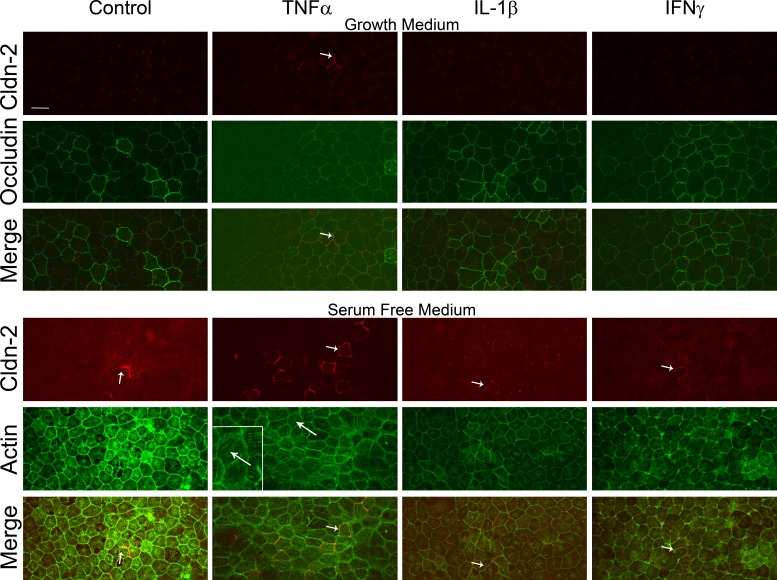
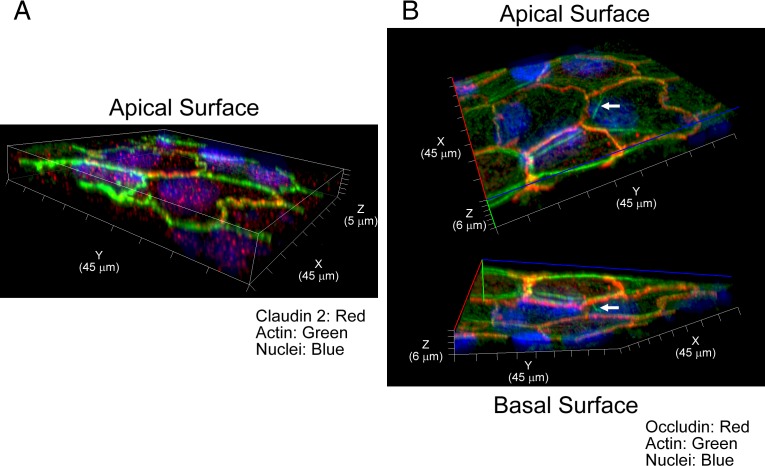
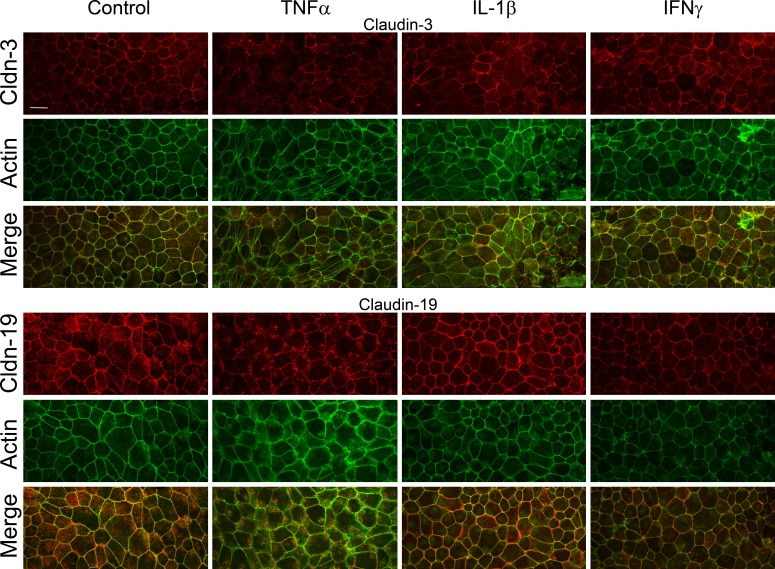
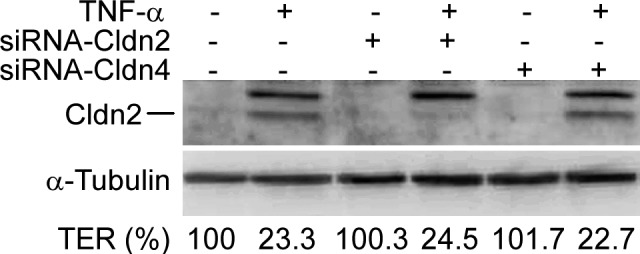
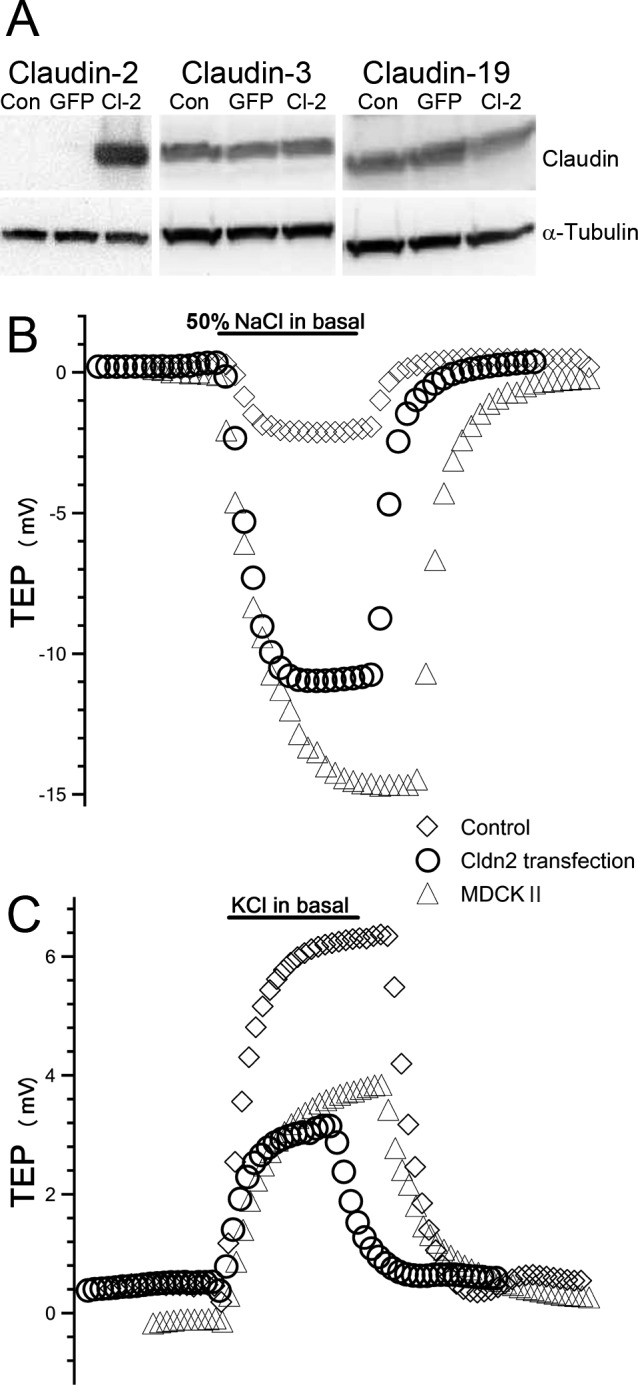
Results: Only TNFα consistently reduced transepithelial electrical resistance (TER) >80%. A serum-free medium revealed two effects of TNFα: (1) decreased TER was observed only when TNFα was added to the apical side of the monolayer, and (2) expression of TNFα receptors and inhibitors of apoptosis were induced from either side of the monolayer. In untreated cultures, tight junctions were slightly cation selective, and this was affected minimally by TNFα. The results were unexplained by effects on claudin-2, claudin-3, claudin-19, occludin, and ZO-1, but changes in the morphology of the junctions and actin cytoskeleton may have a role.

Conclusions: Claudin-19-rich tight junctions have low permeability for ionic and nonionic solutes, and are slightly cation-selective. Claudin-19 is not a direct target of TNFα. TNFα may protect RPE from apoptosis, but makes the monolayer leaky when it is presented to the apical side of the monolayer. Unlike other epithelia, IFNγ failed to augment the effect of TNFα on tight junctions.


Conflict of interest statement

Disclosure: S. Peng, None; G. Gan, None; V.S. Rao, None; R.A. Adelman, None; L.J. Rizzolo, None

Figures

Figure 1.
Figure 1.
Time course for the effects of TNFα . Cells maintained in growth medium were incubated with growth medium containing 0.5% FBS for 24 hours before TNFα or vehicle was added to both media chambers (time 0). The TER was monitored using Endohm electrodes. Error bars: the SE estimated from three cultures. Some error bars are smaller than the symbol.
Figure 2.
Figure 2.
Polarity of the effects of TNFα. TNFα was added to the apical, basal, or both media chambers for 48 hours. (A) In growth medium, the TER was reduced regardless of which medium chamber contained TNFα, but in SFM-1 the TER was significantly reduced only if TNFα was added to the apical medium chamber. (B) Expression of TNFα receptors and cIAP was monitored by qRT2-PCR. For each mRNA, expression relative to that mRNA in control cultures was calculated as described in the methods. (10 = 10× increase due to the cytokine). TNFR1 mRNA was detected readily in control cells. For cultures maintained in growth medium, TNFR1 expression was affected only when TNFα was added to the basal medium chamber. For cultures maintained in SFM-1, TNFα increased expression from either chamber. In control cultures, TNFR2 mRNA was evident only in trace amounts. The effect of TNFα was nonpolarized in each culture. The effect of TNFα was also nonpolarized for cIAP1 and cIAP2.
Figure 3.
Figure 3.
Apoptosis was minimal after a 48-hour exposure to TNFα. (A) Cultures maintained in SFM-1 were incubated with TNFα and labeled using the TUNEL procedure to reveal apoptotic cells. Nuclei were labeled blue by DAPI. Only the occasional microscopy field exhibited a positive cell (arrow), which is purple due to the colocalization of nuclei with the TUNEL reaction product (false colored red). Similar results were obtained in growth medium. (B) As a positive control, cells were treated with DNase I to create a substrate for the TUNEL assay. Most nuclei were purple. Bar: 20 μm.
Figure 4.
Figure 4.
Dilution and bi-ionic electrical potentials for hfRPE maintained in cytokines. Cells were cultured in SFM-1 or growth medium (GM) in the indicated cytokine for two days and transferred to an Ussing chamber in a buffered saline solution containing NaCl, as described in Methods. The presence of BaCl2 and absence of bicarbonate reduced the TEP to near zero. Solutions were changed on the basal side of the culture and measurements were referenced to the basolateral chamber. Bars: indicate the duration of the exposure of the culture to reduced NaCl or KCl. Reintroduction of the normal NaCl solution restored the TEP to baseline. When the NaCl concentration was reduced, a negative potential would indicate selectivity for Na+. When the NaCl was replaced by KCl a positive potential would indicate selectivity for K+. Data were acquired at 10-second intervals; 1.0-minute intervals are indicated by the data points on the graph. Each trace is representative of three experiments. The data were used to calculate the permeation coefficients listed in Table 2.
Figure 5.
Figure 5.
Effect of cytokines on the permeation of PEG550. Cultures were incubated with the indicated cytokines for 48 hours. Similar results were obtained in GM and SFM-1. Only TNFα increased the apparent permeation coefficient (Papp). There was no statistical difference among any of the conditions that included TNFα. When 5 mM EDTA was used to disrupt tight junctions, Papp = 6.7 ± 0.8 × 10⁻⁶ cm/s. Bars: represent the average of 4 to 9 cultures. Error bars: represent the SE. *P < 0.05 compared to the control for the corresponding culture medium.
Figure 6.
Figure 6.
Effect of cytokines on gene expression. Cultures were maintained in GM or SFM-1 and incubated with the indicated cytokine for two days. The expression of mRNA was estimated by real-time RT-PCR. For each mRNA, expression relative to that mRNA in control cultures was calculated as described in Methods. (10 = 10× increase due to the cytokine; 0.1 = 10× decrease). Note that absolute expression levels for claudin-19 and occludin were >10× to 3000× higher than the other claudins, with claudin-16 having the lowest expression. Further, mRNA expression was unaffected by culture medium alone. Cytokines had minimal effects on the expression of mRNAs for occludin and claudin-19. For the minor claudins, cytokines tended to lower the expression or had no effect. *Error bars for claudin-1 represent the range of two independent preparations of hfRPE. Remaining error bars represent the SE for three independent preparations of hfRPE. For each preparation, three cultures were measured.
Figure 7.
Figure 7.
Expression of tight junctional proteins were affected minimally by TNFα in some donors. After a 48-hour exposure to TNFα, steady-state levels of claudin-3, claudin-19, and occludin decreased as much as 50% for many isolates of hfRPE. This donor provides an example of hfRPE whereby TNFα reduced TER by 80% with minimal effect on steady-state levels of these proteins or ZO-1. Note the two ZO-1 isoforms form the doublet indicated by the marker. The faster migrating band also was observed in nonimmune control samples (not shown).
Figure 8.
Figure 8.
Effect of cytokines on the expression of claudin-1 and actin. Cells cultured in growth medium were incubated with the indicated cytokine for 2 days, labeled as described in Methods and imaged by confocal microscopy. The fluorescence channels were merged, and an MIP rendering was generated. Actin (labeled green) was expressed in apical junctional complexes and microvilli. Claudin-1 (labeled red) was expressed in a subset of cells (short arrows). An orange signal appeared where the two proteins co-localized. Claudin-1 and actin also co-localized with occludin (not shown). Although claudin-1 co-localized with actin in TNFα cells, the junctions often were tortuous. Stress fibers (long arrows) in the plane of the tight junction often were evident (cell indicated by long arrow is enlarged in the inset). There was no apparent effect of IL-1β and IFNγ when cells were cultured in growth medium. Similar results were obtained in SFM-1. Bar: 20 μm.
Figure 9.
Figure 9.
Effects of cytokines on the expression of claudin-2, occludin, and actin. Cells cultured in serum-free medium were incubated with the indicated cytokine for 2 days, labeled as described in Methods, and imaged by confocal microscopy. The fluorescence channels were merged, and an MIP rendering was generated. In both media, the immunofluorescent signal for claudin-2 (red) was below the threshold for detection in most cells. Growth Medium: cells cultured in GM were counter-labeled to reveal occludin (green). Claudin-2 could be detected in some cells (short arrows) in cultures exposed to TNFα. Serum-free medium: cells cultured in SFM-1 were counter-labeled to reveal actin (green) in apical stress fibers (long arrows) and along the apical junctional complex, which includes tight junctions. Claudin-2 (short arrows) occasionally was detected in all cultures, but with greater frequency in cultures that contained TNFα. Bar: 20 μm.
Figure 10.
Figure 10.
Localization of claudin-2 in tight junctions. Cells were cultured in GM with TNFα to generate claudin-2–positive cells, labeled as described in Methods. A three-dimensional rendering was generated from the confocal images. White box: indicates the thickness of the monolayer. The images were false colored to reveal the localization of the nucleus (blue), actin (green), claudin-2 (red in A), or occludin (red in B). (A) The image was tilted to view the apical surface and lateral cuts of the monolayer. The apical network of tight junctions was labeled with actin and claudin-2 (the occludin channel was turned off). Only two of the cells in this field expressed claudin-2, as revealed by the yellow-orange signal where actin and claudin-2 co-localize. (B) The same image as (A) was processed to reveal the co-localization of actin and occludin (the claudin-2 channel was turned off). Viewed from the apical surface, all the junctions were yellow due to the ubiquitous co-localization of occludin and actin. Actin also was observed in apical microvilli and stress fibers (arrow) that cross the cell to join a focal point on the apical junctional complex to a focal point of the complex on the opposite side of the cell. Viewed from the basal side, nuclei indicated the depth of the cell and the apical position of the junctional complex. Claudin-2, occludin, and actin co-localized in the apical junctional complex. Note the nonlinear path followed by the tight junction from one vertex of the polygon to the next. Similar results were obtained when ZO-1 was used to mark the tight junctions (not shown).
Figure 11.
Figure 11.
Effect of cytokines on the expression of claudin-3 and claudin-19. Cells cultured in GM were incubated in the indicated cytokine for 2 days, labeled as described in Methods and imaged by confocal microscopy. The fluorescence channels were merged, and an MIP rendering was generated. In control cultures and cultures incubated in IFNγ, most of the junctions appear orange-yellow due to the co-localization of claudin-3, or claudin-19 (labeled red) and actin (labeled green). Similar results were obtained in SFM-1. Bar: 20 μm.
Figure 12.
Figure 12.
Effect of TNFα with reduced levels of claudin-2. Cells were transfected with siRNA against claudin-2 (Cldn2) or against a claudin not expressed by hfRPE, claudin-4 (Cldn4). After claudin-2 levels were reduced (day 9), the indicated cultures were incubated with TNFα for 48 hours. With claudin-2 siRNA, the mRNA levels for claudin-2 were reduced 5 to 7× during the exposure to TNFα. siRNA had no effect on TER. The TER, expressed as a percentage of the control, is the average of three cultures. The TER of the control cells was 1338 Ω × cm2. The SE was less than 5%. Note that a slower migrating, cross-reacting background protein was induced by TNFα. This background protein was not affected by either siRNA.
Figure 13.
Figure 13.
Overexpression of claudin-2 changes the selectivity of RPE tight junctions. (A) hfRPE was uninfected (con) or infected with an adenoviral vector that expressed either green fluorescent protein (GFP) or claudin-2 (Cl-2). After one day protein was extracted and immunoblotted for claudin-2, claudin-3, or claudin-19. Expression of claudin-2 increased, but expression of the other claudins was unaffected. (B) Dilution and (C) bi-ionic potentials were compared for Adeno-GFP infected (Con ⋄) and Adeno-Claudin-2 infected (Cldn2 ○) hfRPE. Claudin-2 rich Madin-Darby Canine Kidney 2 cells (MDCK II ▵) are included as a reference. Bar: indicates when NaCl solution in the basal chamber was replaced with KCl or 50% NaCl solution. Data were collected every 10 seconds; 1.0-minute intervals are indicated on the graph. Each trace is representative of three experiments. The data were used to calculate the permeation coefficients listed in Table 3.

Similar articles

Cited by

References

    1. Yang D, Elner SG, Bian ZM, Till GO, Petty HR, Elner VM. Pro-inflammatory cytokines increase reactive oxygen species through mitochondria and NADPH oxidase in cultured RPE cells. Exp Eye Res. 2007;85:462–472 - PMC - PubMed
    1. Demircan N, Safran BG, Soylu M, Ozcan AA, Sizmaz S. Determination of vitreous interleukin-1 (IL-1) and tumour necrosis factor (TNF) levels in proliferative diabetic retinopathy. Eye (Lond). 2006;20:1366–1369 - PubMed
    1. Foxman EF, Zhang M, Hurst SD, et al. Inflammatory mediators in uveitis: differential induction of cytokines and chemokines in Th1- versus Th2-mediated ocular inflammation. J Immunol. 2002;168:2483–2492 - PubMed
    1. Takase H, Futagami Y, Yoshida T, et al. Cytokine profile in aqueous humor and sera of patients with infectious or noninfectious uveitis. Invest Ophthalmol Vis Sci. 2006;47:1557–1561 - PubMed
    1. Cousins SW, Espinosa-Heidmann DG, Csaky KG. Monocyte activation in patients with age-related macular degeneration: a biomarker of risk for choroidal neovascularization? Arch Ophthalmol. 2004;122:1013–1018 - PubMed

Publication types

MeSH terms