

Multigene interactions and the prediction of depression in the Wisconsin Longitudinal Study
- PMID: 22761283
- PMCID: PMC3391375
- DOI: 10.1136/bmjopen-2012-000944
Multigene interactions and the prediction of depression in the Wisconsin Longitudinal Study
Abstract
Objectives: Single genetic loci offer little predictive power for the identification of depression. This study examined whether an analysis of gene-gene (G × G) interactions of 78 single nucleotide polymorphisms (SNPs) in genes associated with depression and age-related diseases would identify significant interactions with increased predictive power for depression.
Design: A retrospective cohort study.
Setting: A survey of participants in the Wisconsin Longitudinal Study.
Participants: A total of 4811 persons (2464 women and 2347 men) who provided saliva for genotyping; the group comes from a randomly selected sample of Wisconsin high school graduates from the class of 1957 as well as a randomly selected sibling, almost all of whom are non-Hispanic white.
Primary outcome measure: Depression as determine by the Composite International Diagnostic Interview-Short-Form.
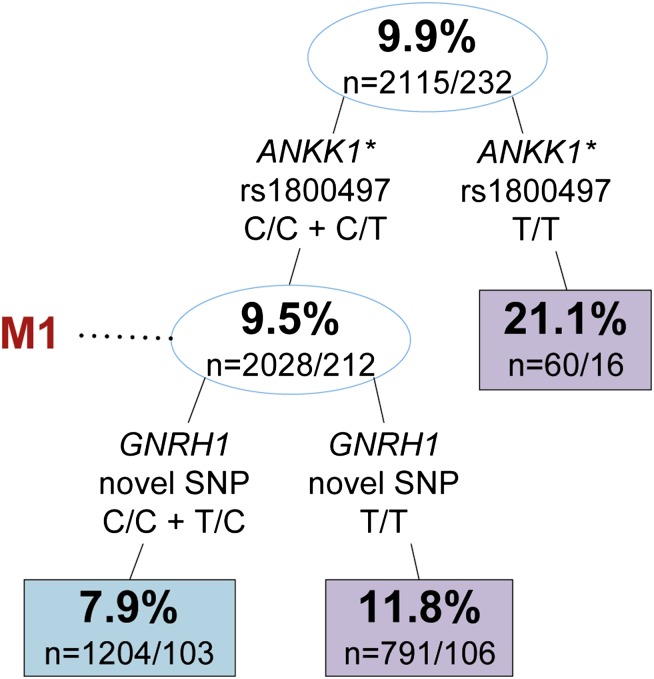
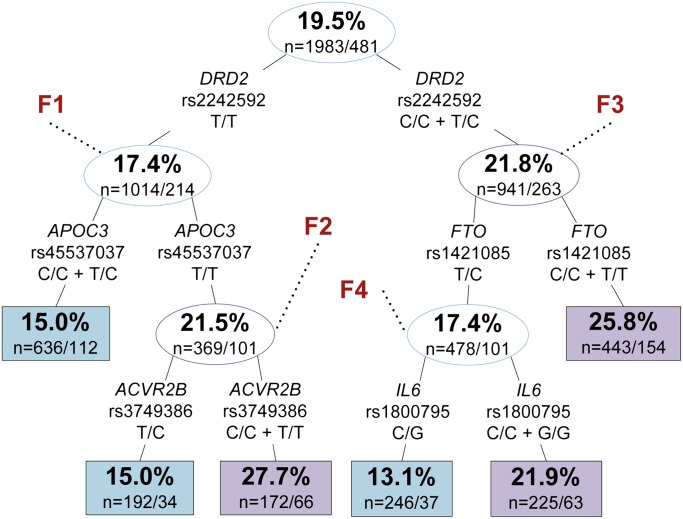
Results: Using a classification tree approach (recursive partitioning (RP)), the authors identified a number of candidate G × G interactions associated with depression. The primary SNP splits revealed by RP (ANKK1 rs1800497 (also known as DRD2 Taq1A) in men and DRD2 rs224592 in women) were found to be significant as single factors by logistic regression (LR) after controlling for multiple testing (p=0.001 for both). Without considering interaction effects, only one of the five subsequent RP splits reached nominal significance in LR (FTO rs1421085 in women, p=0.008). However, after controlling for G × G interactions by running LR on RP-specific subsets, every split became significant and grew larger in magnitude (OR (before) → (after): men: GNRH1 novel SNP: (1.43 → 1.57); women: APOC3 rs2854116: (1.28 → 1.55), ACVR2B rs3749386: (1.11 → 2.17), FTO rs1421085: (1.32 → 1.65), IL6 rs1800795: (1.12 → 1.85)).
Conclusions: The results suggest that examining G × G interactions improves the identification of genetic associations predictive of depression. 4 of the SNPs identified in these interactions were located in two pathways well known to impact depression: neurotransmitter (ANKK1 and DRD2) and neuroendocrine (GNRH1 and ACVR2B) signalling. This study demonstrates the utility of RP analysis as an efficient and powerful exploratory analysis technique for uncovering genetic and molecular pathway interactions associated with disease aetiology.
Conflict of interest statement
Figures
References
-
- CDC Anxiety and Depression. Atlanta, GA: Centers for Disease Control and Prevention, 2009. http://www.cdc.gov/Features/dsBRFSSDepressionAnxiety/ (accessed 18 Oct 2010).
-
- Eley TC, Sugden K, Corsico A, et al. Gene-environment interaction analysis of serotonin system markers with adolescent depression. Mol Psychiatry 2004;9:908–15 - PubMed
-
- Mirowsky J, Ross CE. Age and depression. J Health Soc Behav 1992;33:187–205 - PubMed
-
- Zubenko GS, Zubenko WN, Spiker DG, et al. Malignancy of recurrent, early-onset major depression: a family study. Am J Med Genet 2001;105:690–9 - PubMed
-
- Raymer KA, Waters RF, Price CR. Proposed multigenic Composite Inheritance in major depression. Med Hypotheses 2005;65:158–72 - PubMed
Grants and funding
LinkOut - more resources
Full Text Sources
Other Literature Sources
Molecular Biology Databases
Miscellaneous