. 2012 Jul 24;109(30):12207-12.
doi: 10.1073/pnas.1204929109. Epub 2012 Jul 3.

A soluble bone morphogenetic protein type IA receptor increases bone mass and bone strength

Affiliations

A soluble bone morphogenetic protein type IA receptor increases bone mass and bone strength

Marc Baud'huin et al. Proc Natl Acad Sci U S A. .

Abstract

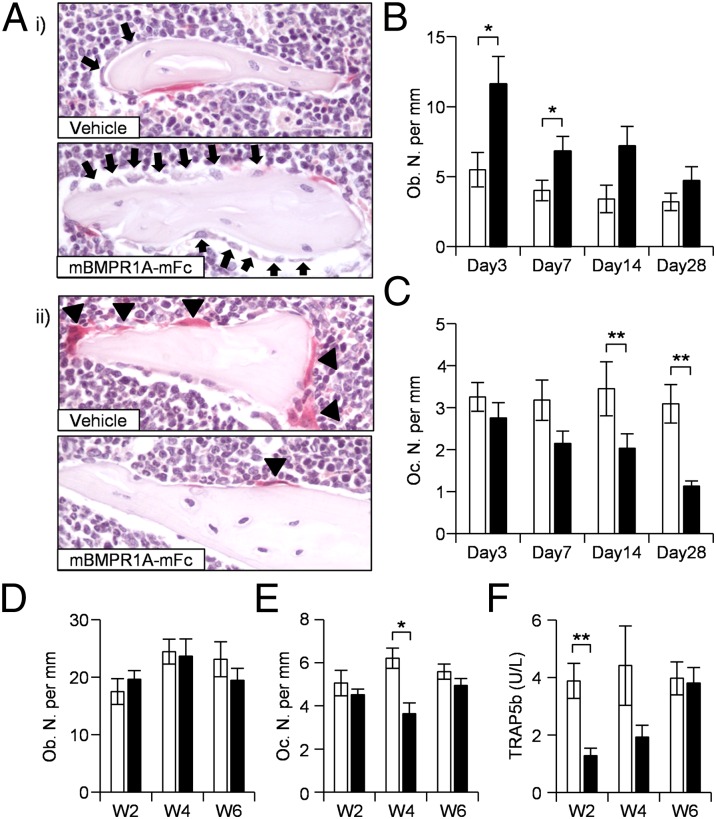
Diseases such as osteoporosis are associated with reduced bone mass. Therapies to prevent bone loss exist, but there are few that stimulate bone formation and restore bone mass. Bone morphogenetic proteins (BMPs) are members of the TGFβ superfamily, which act as pleiotropic regulators of skeletal organogenesis and bone homeostasis. Ablation of the BMPR1A receptor in osteoblasts increases bone mass, suggesting that inhibition of BMPR1A signaling may have therapeutic benefit. The aim of this study was to determine the skeletal effects of systemic administration of a soluble BMPR1A fusion protein (mBMPR1A-mFc) in vivo. mBMPR1A-mFc was shown to bind BMP2/4 specifically and with high affinity and prevent downstream signaling. mBMPR1A-mFc treatment of immature and mature mice increased bone mineral density, cortical thickness, trabecular bone volume, thickness and number, and decreased trabecular separation. The increase in bone mass was due to an early increase in osteoblast number and bone formation rate, mediated by a suppression of Dickkopf-1 expression. This was followed by a decrease in osteoclast number and eroded surface, which was associated with a decrease in receptor activator of NF-κB ligand (RANKL) production, an increase in osteoprotegerin expression, and a decrease in serum tartrate-resistant acid phosphatase (TRAP5b) concentration. mBMPR1A treatment also increased bone mass and strength in mice with bone loss due to estrogen deficiency. In conclusion, mBMPR1A-mFc stimulates osteoblastic bone formation and decreases bone resorption, which leads to an increase in bone mass, and offers a promising unique alternative for the treatment of bone-related disorders.


Conflict of interest statement

Conflict of interest statement: N.S., M.C.-B., D.S., Y.K., K.L., K.W.U., J.U., R.K., E.P., A.G., J.S., R.S.P. are employees of Acceleron Pharma. P.I.C., M.L.B., and E.C. have received research funding from Acceleron Pharma.

Figures

Fig. 1.
Fig. 1.
Cloning and functional characterization of mBMPR1A–mFc. (A) Schematic representation of the mBMPR1A–mFc construct identifying the tissue plasminogen activator (TPA) signal sequence (SS), the murine BMPR1A extracellular domain (ECD) (residues Q24-R152), and the murine IgG2A–Fc domain (mIgG2A–Fc). (B) Kinetic analysis of BMP2 and BMP4 ligands binding to mBMPR1A–mFc performed on Biacore T100 at 20 °C. Antimurine Fc-specfic antibody was immobilized onto CM5 Biacore sensor chip using standard amino-coupling chemistry. mBMPR1A–mFc was captured on an antimurine Fc IgG flow cell at a density of ∼100 relative units (RU). A concentration series of BMP2 and BMP4 (0.078–50 nM) was injected in duplicates over captured receptor and control flow cell at a flow rate of 50 μL/mL. Raw data (black lines) are overlaid with a global fit to a 1:1 model with mass transport term (red lines) obtained using BIAevaluation software. (C) Table summarizing kinetic parameters of BMP2 and BMP4 binding to mBMPR1A–mFc, where ka = association rate constant, kd = dissociation rate constant, and KD = equilibrium dissociation constant. The equilibrium binding constant KD was determined by the ratio of binding rate constants kd/ka. (D) Cell-based analysis of the ability of mBMPR1A–mFc to inhibit BMP2 and BMP4-induced signaling. Experimental sample values are expressed relative to control values and expressed as a ratio of relative luciferase units (RLU). The IC50 for each curve was calculated using SigmaPlot and represents the mean of three independent assays (mean ± SEM).
Fig. 2.
Fig. 2.
mBMPR1A–mFc increases bone mass in healthy 12-wk-old mice. (A) Whole-body BMD, measured by DXA, of mice treated with mBMPR1A–mFc or vehicle (Veh) for 2, 4, or 6 wk. %, percentage of variation of the BMD between baseline and 6 wk of treatment. (B) Representative microCT images of the proximal tibia metaphysis, taken ex vivo, from mice treated with mBMPR1A–mFc (10 mg/kg) or vehicle (Veh) at 6 wk. (C–E) MicroCT analysis of the trabecular bone volume [BV/TV (%)] (C), trabecular number [Tb.N (/mm)] (D), and trabecular thickness [Tb.Th (mm)] (E) of the tibia of mice treated with increasing concentrations of mBMPR1A–mFc or vehicle at 6 wk. (F) MicroCT analysis of the cortical thickness [Ct.Th (mm)] in the tibia of mice treated with increasing concentrations of mBMPR1A–mFc or vehicle at 6 wk. Data represent mean ± SEM, *P < 0.05, **P < 0.01, ***P < 0.001 compare with vehicle (n = 6 for each group).
Fig. 3.
Fig. 3.
mBMPR1A–mFc increases bone mass as early as 7 d following treatment. (A) Representative, longitudinal (i) and transverse (ii) microCT images of the proximal tibia metaphysis, taken ex vivo, from mice treated with mBMPR1A–mFc (10 mg/kg) or vehicle (Veh) for 7 d. (BF) MicroCT analysis of trabecular bone mineral density [BMD (g/cm3)] (B), trabecular bone volume [BV/TV (%)] (C), trabecular number [Tb.N (/mm)] (D), trabecular thickness [Tb.Th (mm)] (E), and trabecular separation [Tb.Sp (mm)] (F) of the tibia of mice treated with mBMPR1A–mFc (black bars) or vehicle (open bars) for 3 (n = 9), 7 (n = 8), 14 (n = 6), and 28 (n = 6) days. Data represent mean ± SEM, *P < 0.05, **P < 0.01, ***P < 0.001 compare with vehicle by Student t test.
Fig. 4.
Fig. 4.
mBMPR1A–mFc induces an early increase in osteoblast numbers followed by a decrease in osteoclast numbers. (A) Histological sections of the tibiae of mice treated with vehicle or mBMPR1A–mFc at day 7 (i) and day 28 (ii). Solid arrows identify osteoblasts and arrowheads identify TRAP+ osteoclasts lining trabecular bone surfaces. (B and C) Histograms showing osteoblast number [Ob.N/BS (/mm)] (B) and osteoclast number [Oc.N/BS (/mm)] (C) in mice treated with vehicle (open bars) or mBMPR1A–mFc (black bars) for 3 (n = 9), 7 (n = 8), 14 (n = 6), and 28 (n = 6). (DF) Histograms showing osteoblast number [Ob.N/BS (/mm)] (D) and osteoclast number [Oc.N/BS (/mm)] (E) in mice treated with vehicle or mBMPR1A–mFc for 2, 4, and 6 wk (n = 6). (F) Histogram showing serum TRAP5b concentration in mice treated with vehicle or mBMPR1A–mFc for 2, 4, and 6 wk. Data represent mean ± SEM *P < 0.05 and **P < 0.01 compared with vehicle by Student t test.
Fig. 5.
Fig. 5.
mBMPR1A–mFc inhibits BMP2 signaling and decreases Dkk1 production in osteoblasts. (A) Western blot analysis of cell lysates, from SaOS2 treated with BMP2 and/or mBMPR1A–mFc illustrating the level of Phospho-SMADs (P-Smads) 1, 5, and 8. Total Smad1 (T-Smad1) confirm equal loading. (B) Quantitative RT-PCR analysis of the effect of BMPR1A–mFc on BMP2 induced Dkk1 mRNA expression in SaOS2 cells. (C) ELISA analysis of the effect of mBMPR1A–mFc on BMP2 induced Dkk1 protein production in the supernatant of SaOS2 cells. Data represent mean ± SEM for three experiments. Unless otherwise stated, **P < 0.01 and ***P < 0.001 compared with control (no mBMPR1A–mFc).
Fig. 6.
Fig. 6.
mBMPR1A–mFc inhibits RANKL production in osteoblasts. (A) Quantitative RT-PCR analysis of the effect of mBMPR1A–mFc on BMP2 induced RANKL mRNA expression in SaOS2 cells. Data represent mean ± SEM for three experiments. (B) Quantitative RT-PCR analysis of the effect of mBMPR1A–mFc on OPG mRNA expression in SaOS2 cells. (C and D) Serum concentration of RANKL (C) and OPG (D) in mice treated with vehicle (open bars) or mBMPR1A–mFc (black bars) for 3 (n = 9), 7 (n = 8), 14 (n = 6), and 28 (n = 6). (E and F) Serum concentration of RANKL (E) and OPG (F) in mice treated with vehicle or mBMPR1A–mFc for 2, 4, and 6 wk (n = 6). *P < 0.05, **P < 0.01, and ***P < 0.001 compare with control. (CF) Data were compared with their corresponding control by Student t test.
Fig. 7.
Fig. 7.
mBMPR1A–mFc prevents ovariectomy-induced bone loss and improves bone strength. (A and B) Whole body (A) and lumbar vertebral (B) BMD measured in vivo by DXA biweekly of ovariectomized (OVX) mice treated with vehicle (Veh) or mBMPR1A–mFc (mBMPR1A) or SHAM-operated mice treated with vehicle. (C and D) Micro-CT analysis of Tb.BV/TV (C) and cortical thickness (D) in the proximal tibia metaphysis of OVX mice treated with vehicle or mBMPR1A–mFc or SHAM mice treated with vehicle. (EG) Three-point bending analysis of stiffness (E), maximum load (F), and estimated Young’s modulus (G) of the left femur of OVX mice treated with vehicle (gray bars) or mBMPR1A–mFc (black bars) or SHAM mice treated with vehicle (open bars). Data represent mean ± SEM *P < 0.05 and ***P < 0.001 compared with OVX + vehicle (n = 8 for each group).

Similar articles

Cited by

References

    1. Wozney JM. Bone morphogenetic proteins. Prog Growth Factor Res. 1989;1:267–280. - PubMed
    1. Massagué J. Receptors for the TGF-beta family. Cell. 1992;69:1067–1070. - PubMed
    1. Keller S, Nickel J, Zhang JL, Sebald W, Mueller TD. Molecular recognition of BMP-2 and BMP receptor IA. Nat Struct Mol Biol. 2004;11:481–488. - PubMed
    1. Hatta T, et al. Identification of the ligand-binding site of the BMP type IA receptor for BMP-4. Biopolymers. 2000;55:399–406. - PubMed
    1. Chen D, Zhao M, Mundy GR. Bone morphogenetic proteins. Growth Factors. 2004;22:233–241. - PubMed

MeSH terms