Clinical Trial
. 2013 Feb;56(1):31-43.
doi: 10.1044/1092-4388(2012/12-0043). Epub 2012 Jul 3.

Auditory brainstem response to complex sounds predicts self-reported speech-in-noise performance

Affiliations
Clinical Trial

Auditory brainstem response to complex sounds predicts self-reported speech-in-noise performance

Samira Anderson et al. J Speech Lang Hear Res. 2013 Feb.

Abstract

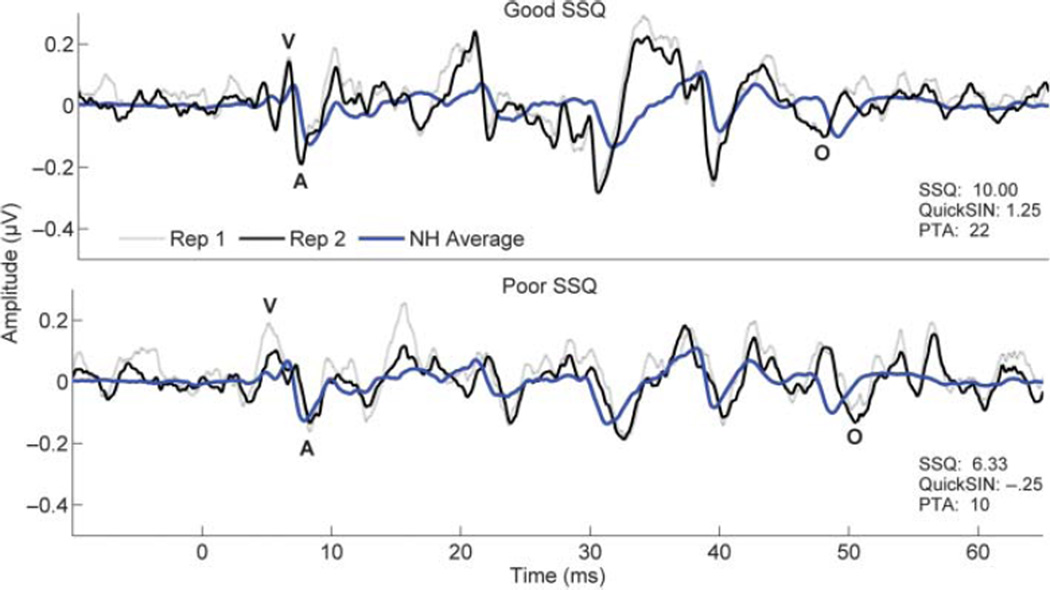
Purpose: To compare the ability of the auditory brainstem response to complex sounds (cABR) to predict subjective ratings of speech understanding in noise on the Speech, Spatial, and Qualities of Hearing Scale (SSQ; Gatehouse & Noble, 2004) relative to the predictive ability of the Quick Speech-in-Noise test (QuickSIN; Killion, Niquette, Gudmundsen, Revit, & Banerjee, 2004) and pure-tone hearing thresholds.

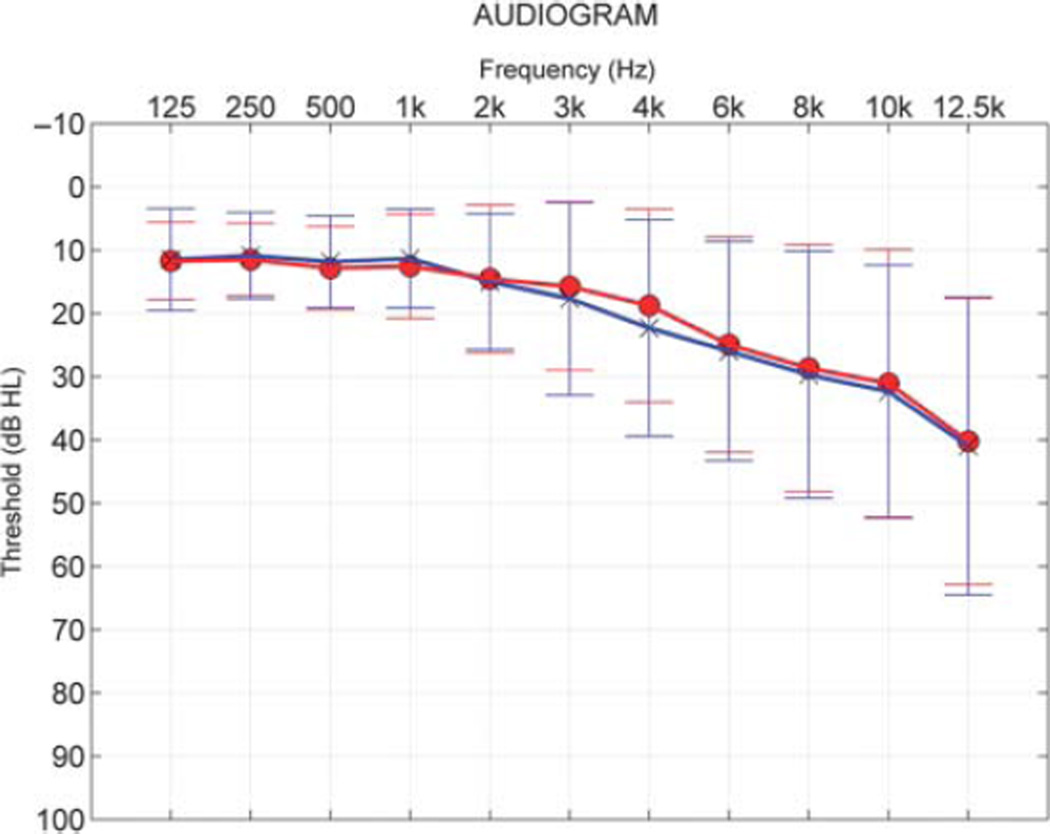
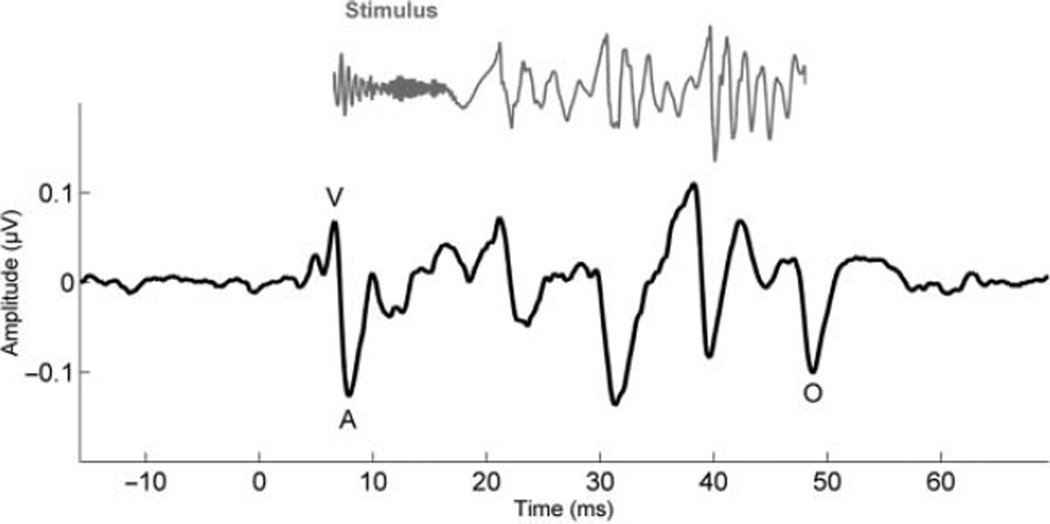
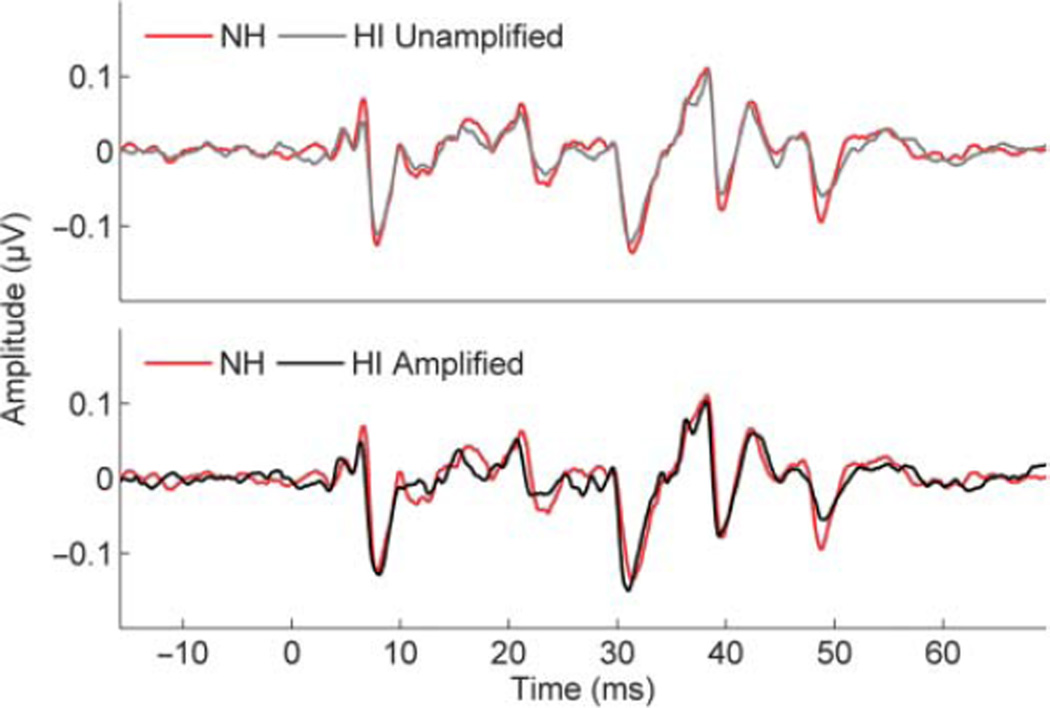
Method: Participants included 111 middle- to older-age adults (range = 45-78) with audiometric configurations ranging from normal hearing levels to moderate sensorineural hearing loss. In addition to using audiometric testing, the authors also used such evaluation measures as the QuickSIN, the SSQ, and the cABR.

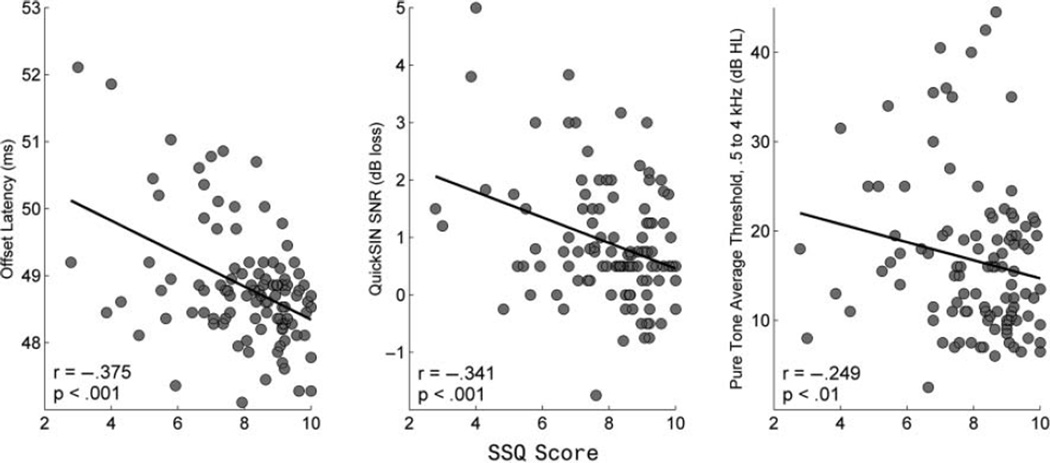
Results: Multiple linear regression analysis indicated that the inclusion of brainstem variables in a model with QuickSIN, hearing thresholds, and age accounted for 30% of the variance in the Speech subtest of the SSQ, compared with significantly less variance (19%) when brainstem variables were not included.

Conclusion: The authors' results demonstrate the cABR's efficacy for predicting self-reported speech-in-noise perception difficulties. The fact that the cABR predicts more variance in self-reported speech-in-noise (SIN) perception than either the QuickSIN or hearing thresholds indicates that the cABR provides additional insight into an individual's ability to hear in background noise. In addition, the findings underscore the link between the cABR and hearing in noise.


Figures

Figure 1
Figure 1
Means are displayed for the right (red) and left (blue) ear audiometric thresholds for all participants (N = 104). Error bars = 1 SD.
Figure 2
Figure 2
The 40-ms stimulus (gray) compared with the grand average response to the monaural presentation of the speech syllable [da] in 61 participants with normal hearing (black). The stimulus was temporally shifted to account for neural lag and to allow visual comparison between the stimulus and the response. The onset peaks are labeled V and A, and the offset peak is labeled O.
Figure 3
Figure 3
Top panel: Grand average responses for 61 normal-hearing (NH) individuals (red) and 51 hearing impaired (HI) individuals (gray) to the unamplified [da] stimulus presented monaurally. Bottom panel: Same as for top panel, except that responses of the HI (black) are recorded to a [da] stimulus that has been created for each individual’s hearing loss based on the National Acoustics Laboratory—Revised (NAL-R) algorithm. The amplification algorithm serves to lessen the effects of reduced audibility on responses of participants who are hearing impaired, especially for the response onset (VA).
Figure 4
Figure 4
Scatter plots demonstrating the relationships among the subjective ratings of speech-in-noise (SIN) performance (Speech subscale of Speech, Spatial, and Qualities of Hearing Scale [SSQ]), offset latency, and clinical measure of SIN ability and hearing thresholds. QuickSIN = Quick Speech-in-Noise test; SNR = signal-to-noise ratio.
Figure 5
Figure 5
Examples of individual waveforms in response to the monaural presentation in participants who have good (left) or poor (right) SSQ scores. Two responses to the stimulus (gray and black) for each participant are overlain to demonstrate replicability. The average response from the normal-hearing group (blue) is also overlain. In spite of the participant’s hearing loss, the good SSQ example (left) shows larger, sharper responses than is observed for the normal-hearing participant with a relatively poorer SSQ score (right). PTA = pure-tone average.

Similar articles

Cited by

References

    1. Agus TR, Akeroyd MA, Noble W, Bhullar N. An analysis of the masking of speech by competing speech using self-report data. The Journal of the Acoustical Society of America. 2009;125:23–26. - PubMed
    1. Aiken SJ, Picton TW. Envelope and spectral frequency-following responses to vowel sounds. Hearing Research. 2008;245:35–47. - PubMed
    1. Anderson S, Kraus N. The potential role of the cABR in assessment and management of hearing impairment. International Journal of Otolaryngology. in press - PMC - PubMed
    1. Anderson S, Parbery-Clark A, White-Schwoch T, Kraus N. Aging affects neural precision of speech encoding. The Journal of Neuroscience. 2012;32:14156–14164. - PMC - PubMed
    1. Anderson S, Parbery-Clark A, Yi H-G, Kraus N. A neural basis of speech-in-noise perception in older adults. Ear and Hearing. 2011;32:750–757. - PMC - PubMed

Publication types

LinkOut - more resources