

Peripheral blood CD4 T-cell and plasmacytoid dendritic cell (pDC) reactivity to herpes simplex virus 2 and pDC number do not correlate with the clinical or virologic severity of recurrent genital herpes
- PMID: 22761381
- PMCID: PMC3446596
- DOI: 10.1128/JVI.00829-12
Peripheral blood CD4 T-cell and plasmacytoid dendritic cell (pDC) reactivity to herpes simplex virus 2 and pDC number do not correlate with the clinical or virologic severity of recurrent genital herpes
Abstract
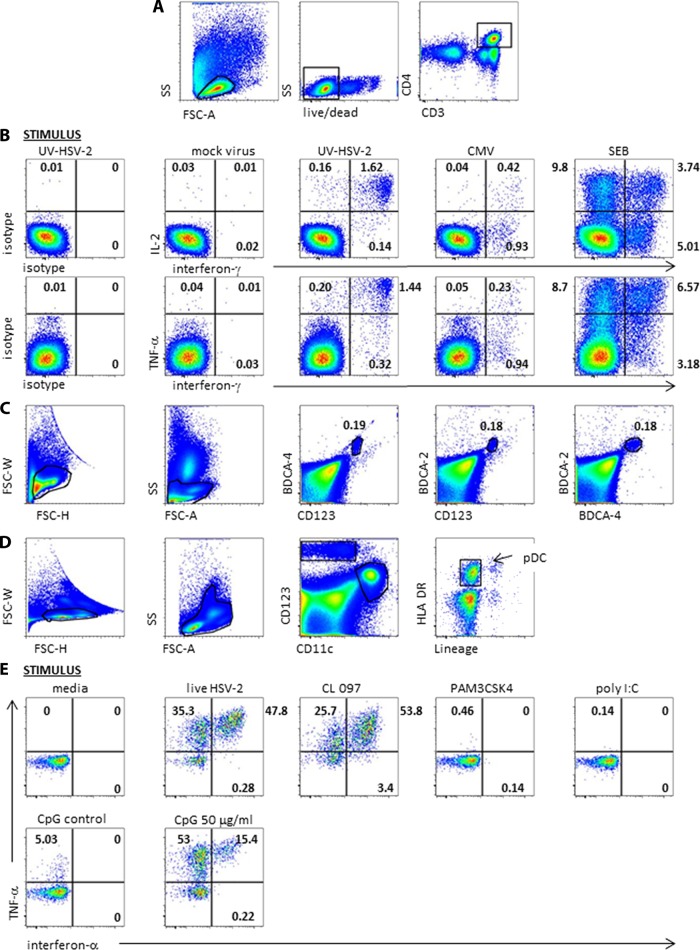
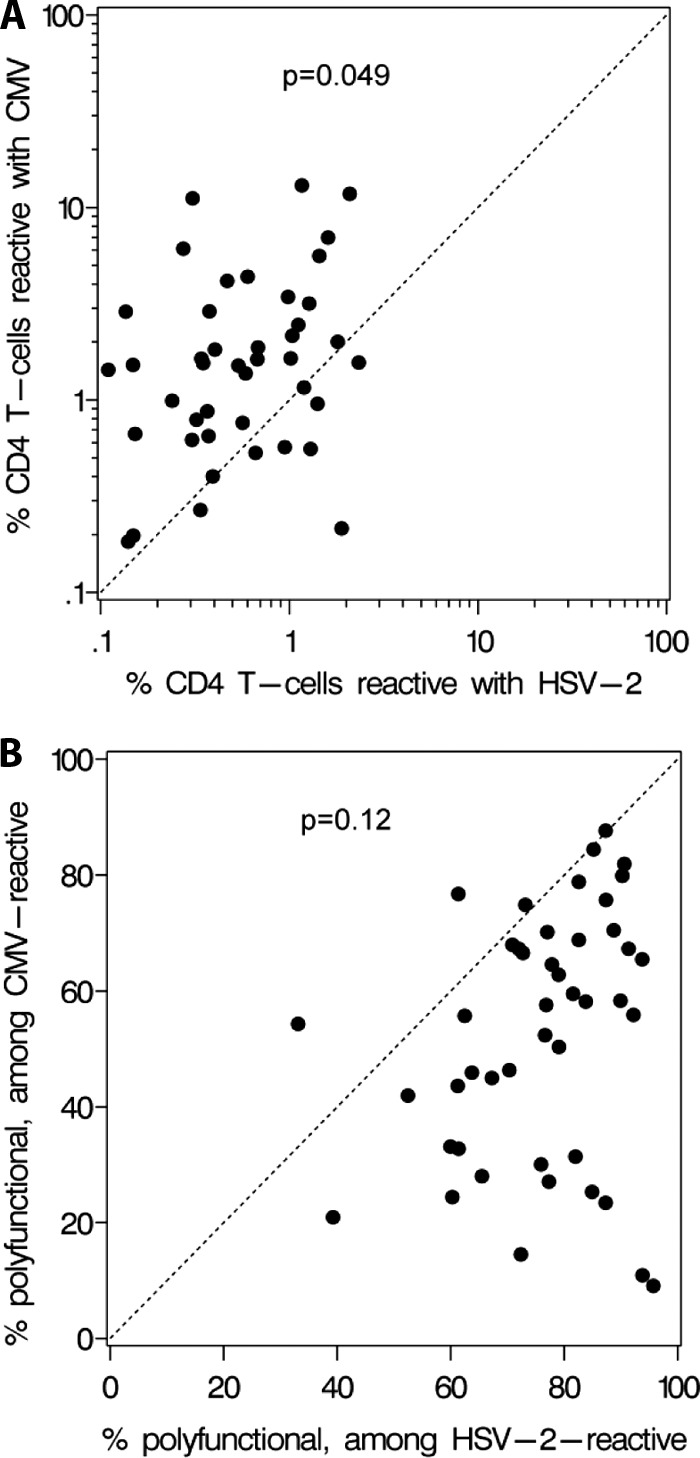
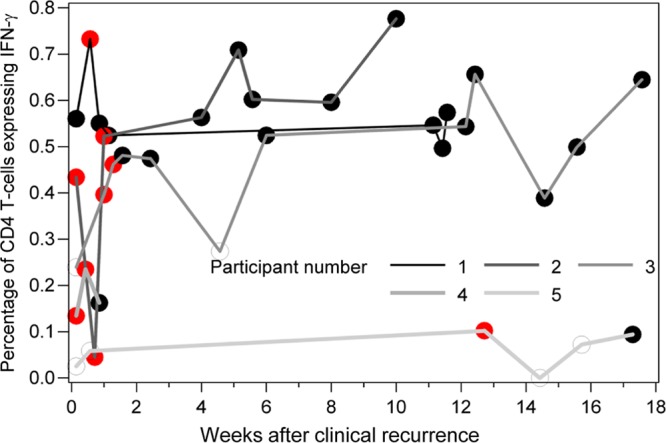
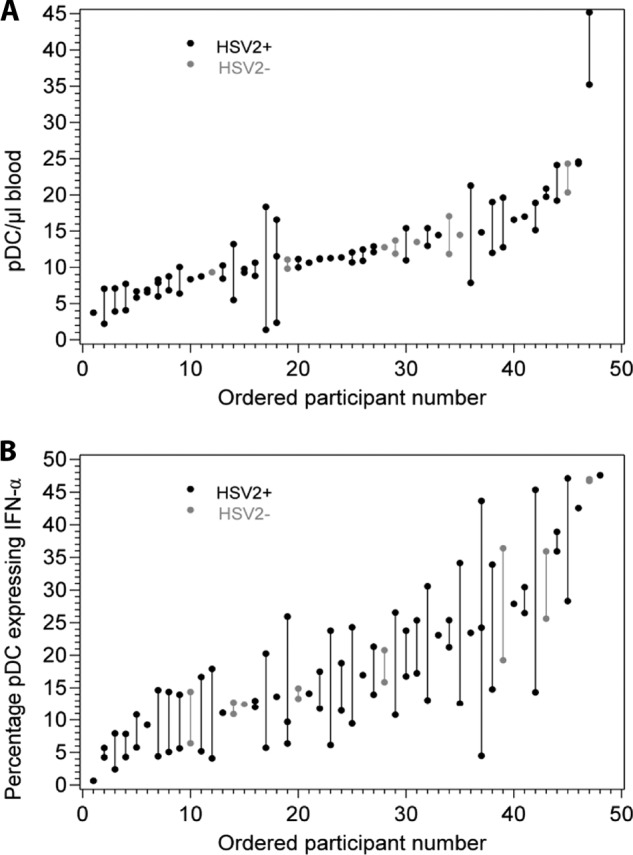
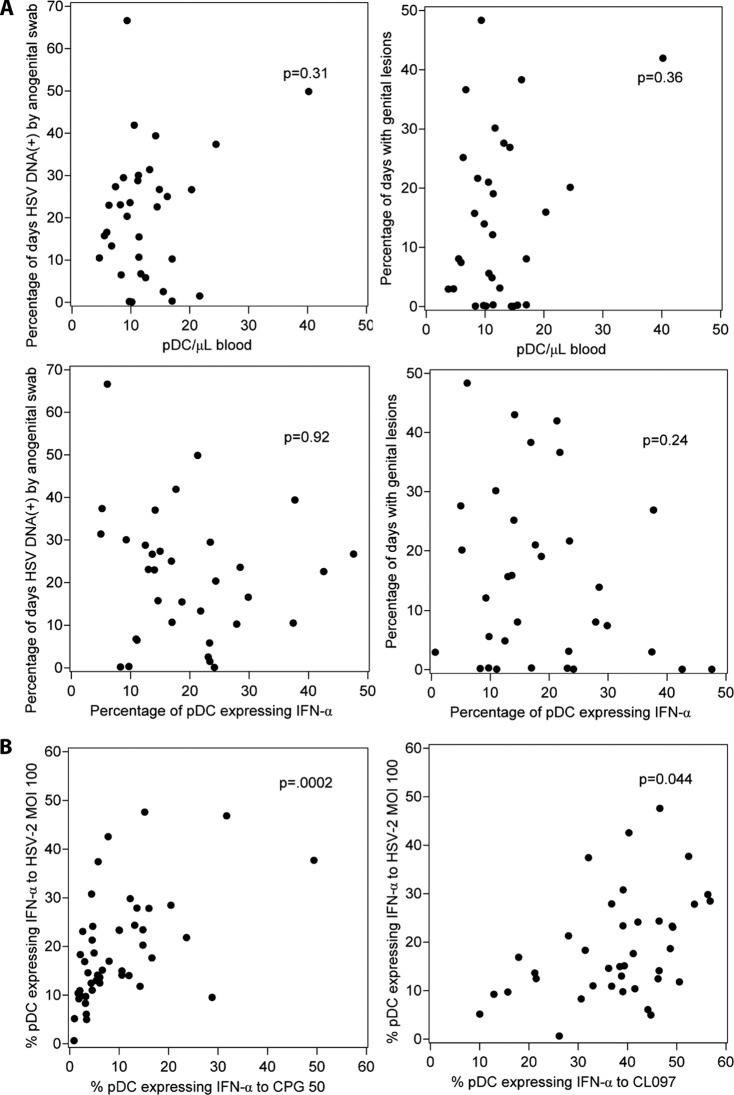
Leukocytes participate in the immune control of herpes simplex virus (HSV). Data from HIV coinfections, germ line mutations, and case reports suggest involvement of CD4 T cells and plasmacytoid dendritic cells (pDC). We investigated the relationships between these cells and recurrent genital herpes disease severity in the general population. Circulating CD4 T-cell responses to HSV-2 were measured in specimens from 67 immunocompetent individuals with measured genital lesion and HSV shedding rates. Similarly, pDC number and functional responses to HSV-2 were analyzed in 40 persons. CD4 responses and pDC concentrations and responses ranged as much as 100-fold between persons while displaying moderate within-person consistency over time. No correlations were observed between these immune response parameters and genital HSV-2 severity. Cytomegalovirus (CMV) coinfection was not correlated with differences in HSV-2-specific CD4 T-cell responses. The CD4 T-cell response to HSV-2 was much more polyfunctional than was the response to CMV. These data suggest that other immune cell subsets with alternate phenotypes or anatomical locations may be responsible for genital herpes control in chronically infected individuals.
Figures

Similar articles
-
Single-cell RNA sequencing reveals the diversity of the immunological landscape response to genital herpes.Virol Sin. 2024 Dec;39(6):860-874. doi: 10.1016/j.virs.2024.10.003. Epub 2024 Oct 18. Virol Sin. 2024. PMID: 39426602 Free PMC article.
-
Subclinical Genital Herpes Shedding in HIV/Herpes Simplex Virus 2-Coinfected Women during Antiretroviral Therapy Is Associated with an Increase in HIV Tissue Reservoirs and Potentially Promotes HIV Evolution.J Virol. 2020 Dec 9;95(1):e01606-20. doi: 10.1128/JVI.01606-20. Print 2020 Dec 9. J Virol. 2020. PMID: 33028713 Free PMC article.
-
Novel Role for Interleukin-17 in Enhancing Type 1 Helper T Cell Immunity in the Female Genital Tract following Mucosal Herpes Simplex Virus 2 Vaccination.J Virol. 2017 Nov 14;91(23):e01234-17. doi: 10.1128/JVI.01234-17. Print 2017 Dec 1. J Virol. 2017. PMID: 28956763 Free PMC article.
-
Herpes simplex virus-2 in the genital mucosa: insights into the mucosal host response and vaccine development.Curr Opin Infect Dis. 2012 Feb;25(1):92-9. doi: 10.1097/QCO.0b013e32834e9a56. Curr Opin Infect Dis. 2012. PMID: 22143115 Review.
-
Innate immunity to herpes simplex virus type 2.Viral Immunol. 2003;16(4):475-90. doi: 10.1089/088282403771926300. Viral Immunol. 2003. PMID: 14733735 Review.
Cited by
-
T-cell immunity to human alphaherpesviruses.Curr Opin Virol. 2013 Aug;3(4):452-60. doi: 10.1016/j.coviro.2013.04.004. Epub 2013 May 8. Curr Opin Virol. 2013. PMID: 23664660 Free PMC article. Review.
-
Herpes simplex virus-2 dynamics as a probe to measure the extremely rapid and spatially localized tissue-resident T-cell response.Immunol Rev. 2018 Sep;285(1):113-133. doi: 10.1111/imr.12672. Immunol Rev. 2018. PMID: 30129205 Free PMC article. Review.
-
Pathogenesis and virulence of herpes simplex virus.Virulence. 2021 Dec;12(1):2670-2702. doi: 10.1080/21505594.2021.1982373. Virulence. 2021. PMID: 34676800 Free PMC article. Review.
-
A Comprehensive Overview of Epidemiology, Pathogenesis and the Management of Herpes Labialis.Viruses. 2023 Jan 13;15(1):225. doi: 10.3390/v15010225. Viruses. 2023. PMID: 36680265 Free PMC article. Review.
-
Single-cell RNA sequencing reveals the diversity of the immunological landscape response to genital herpes.Virol Sin. 2024 Dec;39(6):860-874. doi: 10.1016/j.virs.2024.10.003. Epub 2024 Oct 18. Virol Sin. 2024. PMID: 39426602 Free PMC article.
References
-
- Abbo L, et al. 2007. Selective defect in plasmacyoid dendritic cell function in a patient with AIDS-associated atypical genital herpes simplex vegetans treated with imiquimod. Clin. Infect. Dis. 44:e25–e27 - PubMed
-
- Asanuma H, Sharp M, Maecker HT, Maino VC, Arvin AM. 2000. Frequencies of memory T cells specific for varicella-zoster virus, herpes simplex virus and cytomegalovirus determined by intracellular detection of cytokine expression. J. Infect. Dis. 181:859–866 - PubMed
-
- Bochud PY, Magaret AS, Koelle DM, Aderem A, Wald A. 2007. Polymorphisms in TLR2 are associated with increased viral shedding and lesional rate in patients with genital herpes simplex virus type 2 infection. J. Infect. Dis. 196:505–509 - PubMed
Publication types
MeSH terms
Substances
Grants and funding
LinkOut - more resources
Full Text Sources
Medical
Research Materials
