. 2012 Sep;86(18):9919-28.
doi: 10.1128/JVI.00388-12. Epub 2012 Jul 3.

Hepatitis C virus-mediated inhibition of cathepsin S increases invariant-chain expression on hepatocyte surface

Affiliations

Hepatitis C virus-mediated inhibition of cathepsin S increases invariant-chain expression on hepatocyte surface

Hangeun Kim et al. J Virol. 2012 Sep.

Abstract

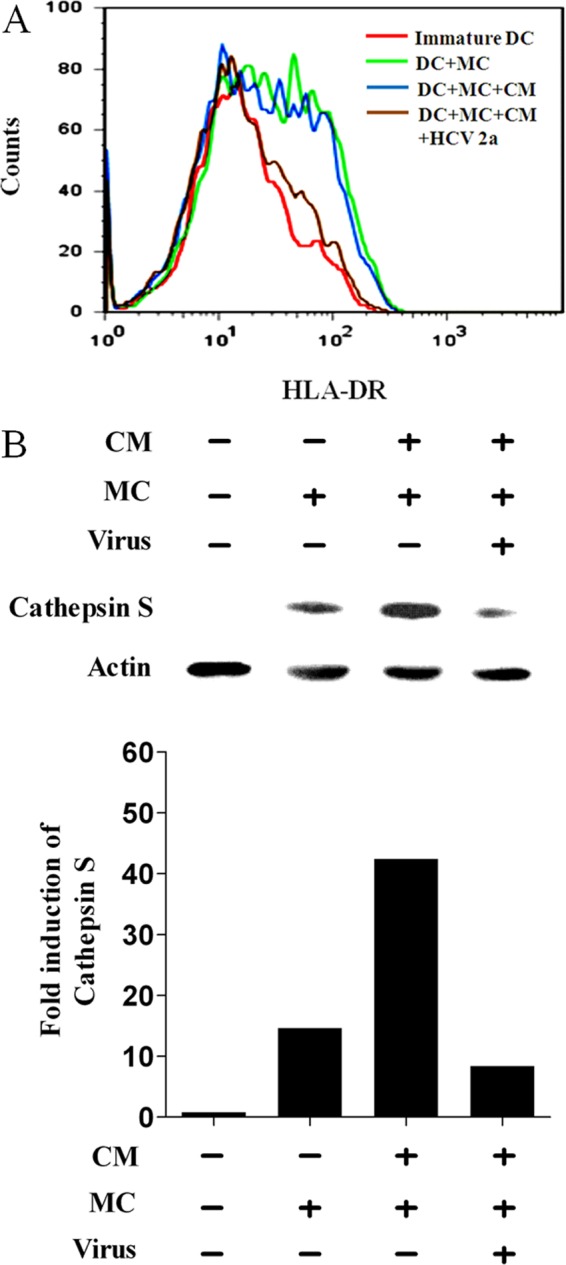
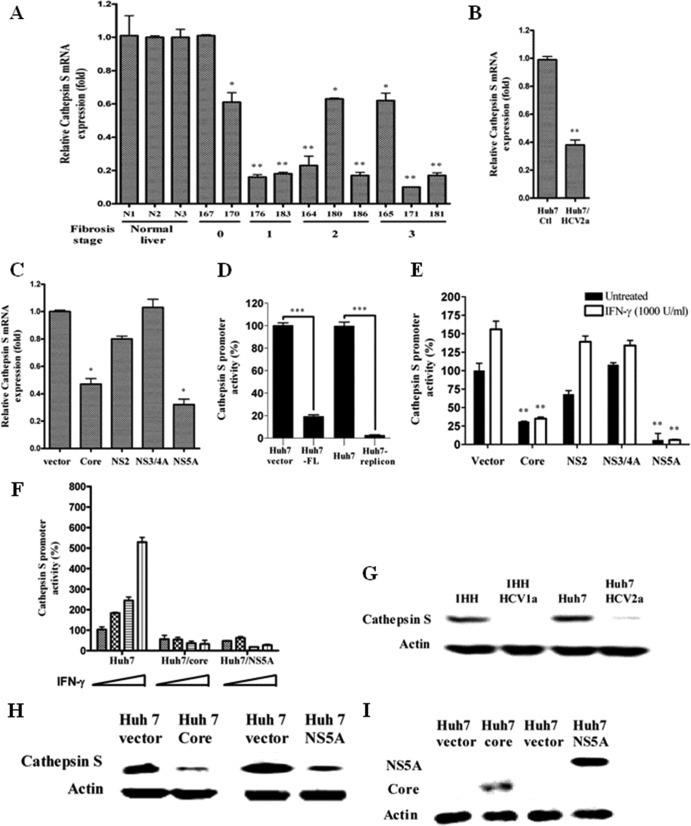
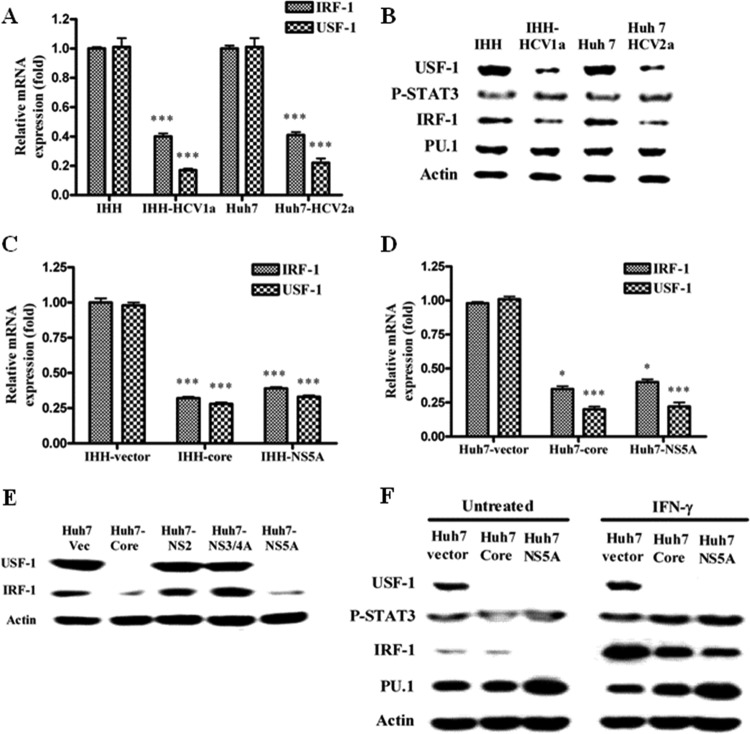
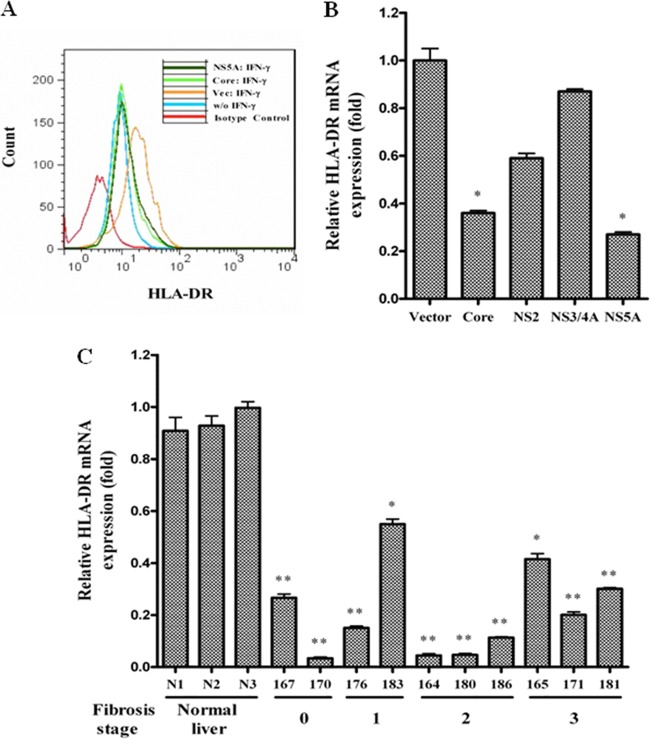
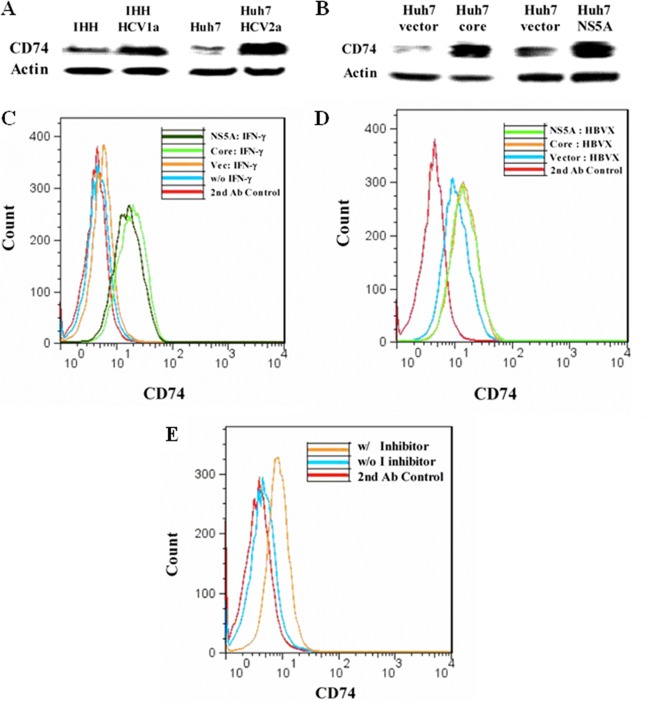
Hepatocytes are the main source of hepatitis C virus (HCV) replication and contain the maximum viral load in an infected person. Chronic HCV infection is characterized by weak cellular immune responses to viral proteins. Cathepsin S is a lysosomal cysteine protease and controls HLA-DR-antigen complex presentation through the degradation of the invariant chain. In this study, we examined the effect of HCV proteins on cathepsin S expression and found it to be markedly decreased in dendritic cells (DCs) exposed to HCV or in hepatocytes expressing HCV proteins. The downregulation of cathepsin S was mediated by HCV core and NS5A proteins involving inhibition of the transcription factors interferon regulatory factor 1 (IRF-1) and upstream stimulatory factor 1 (USF-1) in gamma interferon (IFN-γ)-treated hepatocytes. Inhibition of cathepsin S by HCV proteins increased cell surface expression of the invariant chain. In addition, hepatocytes stably transfected with HCV core or NS5A inhibited HLA-DR expression. Together, these results suggested that HCV has an inhibitory role on cathepsin S-mediated major histocompatibility complex (MHC) class II maturation, which may contribute to weak immunogenicity of viral antigens in chronically infected humans.


Figures

Fig 1
Fig 1
Analyses for HLA-DR and cathepsin S status in DCs following exposure to HCV. (A) FACS analysis of a typical expression profile of HLA-DR on the surfaces of monocyte-derived DCs from a healthy volunteer after stimulation with MC as a positive control. The DCs were treated separately with CM from hepatocytes as a mock control or exposed to cell culture-grown HCV genotype 2a. (B) Western blot analysis displaying cathepsin S expression levels in DCs following incubation with cell culture-grown HCV and MC. The DCs were also incubated with CM alone or together with MC from mock-infected cells. Densitometric analysis of the Western blot result displaying fold induction of cathepsin S is shown in the bar graph below.
Fig 2
Fig 2
HCV inhibits cathepsin S production. (A, B, and C) Real-time PCR analysis for cathepsin mRNA status in chronically HCV-infected human liver biopsy specimens, in cell culture-grown HCV-infected human hepatocytes, and in HCV gene-transfected hepatocytes, respectively. mRNA expression levels in all experimental samples were normalized with 18S RNA. (D) Huh7 cells were transiently cotransfected with a pGL3/cathepsin S promoter-luciferase construct and FL HCV genotype 1a. HCV genotype 1b subgenomic replicon-harboring cells were also used in the promoter assay. Cell lysates were analyzed for cathepsin S promoter activity after 48 h. The promoter activity (%) was compared with that of vector-transfected or control Huh7 cells arbitrarily set at 100%. The P value (***, P < 0.001) was determined by using a two-tailed t test. (E) Huh7 cells were transiently cotransfected with vector or the HCV genomic region (core, NS2, NS3/4A, or NS5A) and a pGL3/cathepsin S promoter-luciferase construct. After 24 h of transfection, the cells were treated or not with IFN-γ for 18 h and examined for luciferase activity using a firefly luciferase assay system. The P value was determined by using a two-tailed t test. (A to C and F) P values were as follows: *, P < 0.05; **, P < 0.01. (D) The P value (***) was less than 0.001 compared to normal liver biopsy samples or vector control. (F) Cells were treated with increasing doses of IFN-γ (0, 500, 1,000, and 2,000 U/ml) for 18 h after transient cotransfection with pGL3/cathepsin S promoter-luciferase construct and core or NS5A plasmid to analyze IFN-γ-induced cathepsin S promoter activity. The results are shown as the means and standard deviations from triplicate experiments. The P value was determined by one-way ANOVA (P < 0.0293). (G and H) Cathepsin S protein expression was analyzed in HCV-infected or HCV gene-transfected cells by Western blot analyses. (I) Western blot analyses for HCV core or NS5A protein expression in transfected Huh7 cells.
Fig 3
Fig 3
HCV infection or transfection of HCV core/NS5A inhibits IRF-1 and USF-1 expression in hepatocytes. (A) Real-time PCR analyses for the mRNA expression status of IRF-1 and USF-1 in HCV genotype 1a- or 2a-infected IHH or Huh7 cells. The results were normalized with 18S RNA and are presented as mean values and standard deviations from triplicate experiments. The asterisks indicate statistical significance (***, P < 0.001). (B) IHH and Huh 7 cells were infected with HCV genotype 1a or 2a. Whole-cell lysates were prepared 5 days after infection. The expression levels of transcription factors, USF-1, phospho-STAT3, IRF-1, and PU.1, were detected by Western blot analysis. (C) Real-time PCR analyses for the mRNA expression status of IRF-1 and USF-1 in IHH transduced with lentivirus vector expressing core or NS5A from HCV genotype 1a. (D) Similar analyses were performed using Huh-7 cells transiently transfected with mammalian expression vector encoding core or NS5A from HCV genotype 1a. The results in both panels C and D were analyzed as described for panel A. The asterisks indicate statistical significance (*, P < 0.05; ***, P < 0.001). (E) Huh7 cells were transiently transfected with the HCV core, NS2, NS3/4A, or NS5A genomic region, and expression of transcription factors was analyzed similarly by Western blotting after 48 h. (F) Huh7 cells were transiently transfected with HCV core or NS5A and treated or not with 1,000 U/ml of IFN-γ for 2 h, and expression of the transcription factors was analyzed by Western blotting. The blots were reprobed with an antibody to actin for comparison of the protein loads in each lane.
Fig 4
Fig 4
Inhibition of HLA-DR expression on hepatocytes by HCV proteins. (A) HCV core- or NS5A-transfected Huh7 cells were stimulated with 500 U/ml of IFN-γ for 48 h and analyzed for HLA-DR cell surface expression after immunostaining with FITC-conjugated specific antibody. Cells stained with the FITC-mouse IgG2a(κ) isotype control are shown as the negative control. (B) Real-time PCR analysis for HLA-DR mRNA status in HCV gene-transfected IHH treated with IFN-γ. (C) HLA-DR mRNA status in chronically HCV-infected human liver biopsy specimens. The mRNA level was normalized with 18S RNA. The results are shown as means and standard deviations from triplicate assays. The P value was determined by using a two-tailed t test: *, P < 0.05; **, P < 0.01 compared to vector control or normal liver biopsy samples.
Fig 5
Fig 5
Invariant-chain degradation is inhibited by HCV infection or transfection with HCV core/NS5A. (A) Hepatocytes were infected with HCV genotype 1a or 2a. Cell lysates prepared 5 days after infection were analyzed for invariant-chain (CD74) expression by Western blotting. Mock-infected cells were treated as controls for comparison. (B) Huh7 cells transfected with HCV core or NS5A were analyzed similarly for expression of CD74 by Western blotting. (C) Cell surface expression of CD74 on HCV core- and NS5A-transfected Huh7 cells, stimulated or not with 500 U/ml IFN-γ for 48 h. The results of FACS analyses after immunostaining with anti-CD74 antibody, followed by FITC-conjugated goat anti-mouse treatment, are shown. (D) IHH were transfected with plasmids containing HBV X to enhance HLA-DR expression. The transfectants were stimulated with 500 U/ml IFN-γ, and CD74 cell surface expression was examined after 48 h by FACS. (E) Huh7 cells were treated or not with cathepsin S inhibitor (2.36 μM) and stimulated with 500 U/ml IFN-γ for 48 h. Cell surface expression of CD74 was examined by FACS. The result from cells stained with a secondary antibody is shown as the negative control.

Similar articles

Cited by

References

    1. Ait-Goughoulte M, et al. 2010. Hepatitis C virus core protein interacts with fibrinogen-beta and attenuates cytokine stimulated acute-phase response. Hepatology 51:1505–1513 - PMC - PubMed
    1. Auffermann-Gretzinger S, Keeffe EB, Levy S. 2001. Impaired dendritic cell maturation in patients with chronic, but not resolved, hepatitis C virus infection. Blood 97:3171–3176 - PubMed
    1. Bain C, et al. 2001. Impaired allostimulatory function of dendritic cells in chronic hepatitis C infection. Gastroenterology 120:512–524 - PubMed
    1. Banerjee A, et al. 2011. Transcriptional repression of C4 complement by hepatitis C virus proteins. J. Virol. 85:4157–4166 - PMC - PubMed
    1. Banerjee A, Meyer K, Mazumdar B, Ray RB, Ray R. 2010. Hepatitis C virus differentially modulates activation of forkhead transcription factors and insulin-induced metabolic gene expression. J. Virol. 84:5936–5946 - PMC - PubMed

Publication types

MeSH terms