

Combination of immune and viral factors distinguishes low-risk versus high-risk HIV-1 disease progression in HLA-B*5701 subjects
- PMID: 22761389
- PMCID: PMC3446568
- DOI: 10.1128/JVI.01165-12
Combination of immune and viral factors distinguishes low-risk versus high-risk HIV-1 disease progression in HLA-B*5701 subjects
Abstract
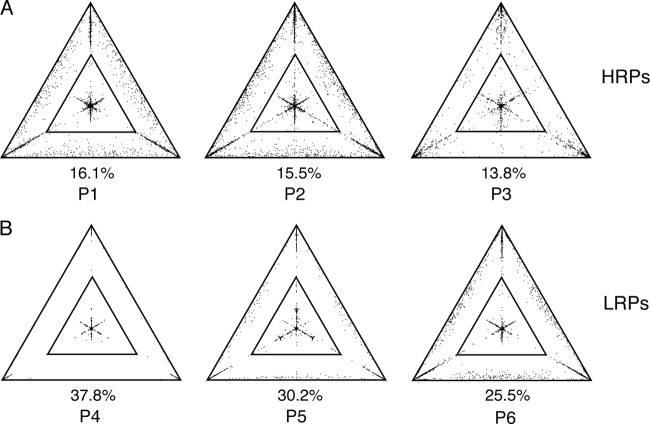
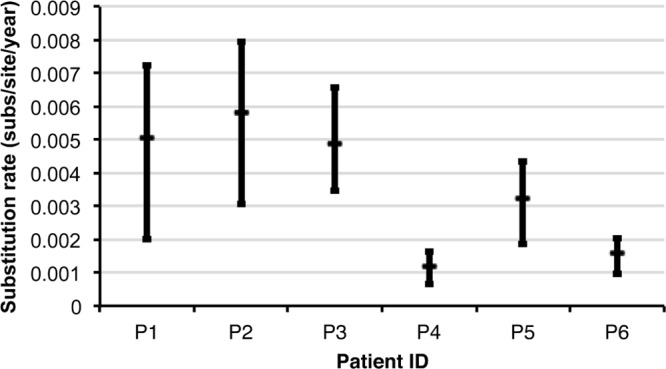
HLA-B*5701 is the host factor most strongly associated with slow HIV-1 disease progression, although rates can vary within this group. Underlying mechanisms are not fully understood but likely involve both immunological and virological dynamics. The present study investigated HIV-1 in vivo evolution and epitope-specific CD8(+) T cell responses in six HLA-B*5701 patients who had not received antiretroviral treatment, monitored from early infection for up to 7 years. The subjects were classified as high-risk progressors (HRPs) or low-risk progressors (LRPs) based on baseline CD4(+) T cell counts. Dynamics of HIV-1 Gag p24 evolution and multifunctional CD8(+) T cell responses were evaluated by high-resolution phylogenetic analysis and polychromatic flow cytometry, respectively. In all subjects, substitutions occurred more frequently in flanking regions than in HLA-B*5701-restricted epitopes. In LRPs, p24 sequence diversity was significantly lower; sequences exhibited a higher degree of homoplasy and more constrained mutational patterns than HRPs. The HIV-1 intrahost evolutionary rate was also lower in LRPs and followed a strict molecular clock, suggesting neutral genetic drift rather than positive selection. Additionally, polyfunctional CD8(+) T cell responses, particularly to TW10 and QW9 epitopes, were more robust in LRPs, who also showed significantly higher interleukin-2 (IL-2) production in early infection. Overall, the findings indicate that HLA-B*5701 patients with higher CD4 counts at baseline have a lower risk of HIV-1 disease progression because of the interplay between specific HLA-linked immune responses and the rate and mode of viral evolution. The study highlights the power of a multidisciplinary approach, integrating high-resolution evolutionary and immunological data, to understand mechanisms underlying HIV-1 pathogenesis.
Figures


References
-
- Bailey JR, et al. 2007. Evolution of HIV-1 in an HLA-B*57-positive patient during virologic escape. J. Infect. Dis. 196:50–55 - PubMed
Publication types
MeSH terms
Substances
Associated data
- Actions
- Actions
- Actions
- Actions
- Actions
- Actions
- Actions
- Actions
- Actions
- Actions
- Actions
- Actions
- Actions
- Actions
- Actions
- Actions
- Actions
- Actions
- Actions
- Actions
- Actions
- Actions
- Actions
- Actions
- Actions
- Actions
- Actions
- Actions
- Actions
- Actions
- Actions
- Actions
- Actions
- Actions
- Actions
- Actions
- Actions
- Actions
- Actions
- Actions
- Actions
- Actions
- Actions
- Actions
- Actions
- Actions
- Actions
- Actions
- Actions
- Actions
- Actions
- Actions
- Actions
- Actions
- Actions
- Actions
- Actions
- Actions
- Actions
- Actions
- Actions
- Actions
- Actions
- Actions
- Actions
- Actions
- Actions
- Actions
- Actions
- Actions
- Actions
- Actions
- Actions
- Actions
- Actions
- Actions
- Actions
- Actions
- Actions
- Actions
- Actions
- Actions
- Actions
- Actions
- Actions
- Actions
- Actions
- Actions
- Actions
- Actions
- Actions
- Actions
- Actions
- Actions
- Actions
- Actions
- Actions
- Actions
- Actions
- Actions
- Actions
- Actions
- Actions
- Actions
- Actions
- Actions
- Actions
- Actions
- Actions
- Actions
- Actions
- Actions
- Actions
- Actions
- Actions
- Actions
- Actions
- Actions
- Actions
- Actions
- Actions
- Actions
- Actions
- Actions
- Actions
- Actions
- Actions
- Actions
- Actions
- Actions
- Actions
- Actions
- Actions
- Actions
- Actions
- Actions
- Actions
- Actions
- Actions
- Actions
- Actions
- Actions
- Actions
- Actions
- Actions
- Actions
- Actions
- Actions
- Actions
- Actions
- Actions
- Actions
- Actions
- Actions
- Actions
- Actions
- Actions
- Actions
- Actions
- Actions
- Actions
- Actions
- Actions
- Actions
- Actions
- Actions
- Actions
- Actions
- Actions
- Actions
- Actions
- Actions
- Actions
- Actions
- Actions
- Actions
- Actions
- Actions
- Actions
- Actions
- Actions
- Actions
- Actions
- Actions
- Actions
- Actions
- Actions
- Actions
- Actions
- Actions
- Actions
- Actions
- Actions
- Actions
- Actions
- Actions
- Actions
- Actions
- Actions
- Actions
- Actions
- Actions
- Actions
- Actions
- Actions
- Actions
- Actions
- Actions
- Actions
- Actions
- Actions
- Actions
- Actions
- Actions
- Actions
- Actions
- Actions
- Actions
- Actions
- Actions
- Actions
- Actions
- Actions
- Actions
- Actions
- Actions
- Actions
- Actions
- Actions
- Actions
- Actions
- Actions
- Actions
- Actions
- Actions
- Actions
- Actions
- Actions
- Actions
- Actions
- Actions
- Actions
- Actions
- Actions
- Actions
- Actions
- Actions
- Actions
- Actions
- Actions
- Actions
- Actions
- Actions
- Actions
- Actions
- Actions
- Actions
- Actions
- Actions
- Actions
- Actions
- Actions
- Actions
- Actions
- Actions
- Actions
- Actions
- Actions
- Actions
- Actions
- Actions
- Actions
- Actions
- Actions
- Actions
- Actions
- Actions
- Actions
- Actions
- Actions
- Actions
- Actions
- Actions
- Actions
- Actions
- Actions
- Actions
- Actions
- Actions
- Actions
- Actions
- Actions
- Actions
- Actions
- Actions
- Actions
- Actions
- Actions
- Actions
- Actions
- Actions
- Actions
- Actions
- Actions
- Actions
- Actions
- Actions
- Actions
- Actions
- Actions
- Actions
- Actions
- Actions
- Actions
- Actions
- Actions
- Actions
- Actions
- Actions
- Actions
- Actions
- Actions
- Actions
- Actions
- Actions
- Actions
- Actions
- Actions
- Actions
- Actions
- Actions
- Actions
- Actions
- Actions
- Actions
- Actions
- Actions
- Actions
- Actions
- Actions
- Actions
- Actions
- Actions
- Actions
- Actions
- Actions
- Actions
- Actions
- Actions
- Actions
- Actions
- Actions
- Actions
- Actions
- Actions
- Actions
- Actions
- Actions
- Actions
- Actions
- Actions
- Actions
- Actions
- Actions
- Actions
- Actions
- Actions
- Actions
- Actions
- Actions
- Actions
- Actions
- Actions
- Actions
- Actions
- Actions
- Actions
- Actions
- Actions
- Actions
- Actions
- Actions
- Actions
- Actions
- Actions
- Actions
- Actions
- Actions
- Actions
- Actions
- Actions
- Actions
- Actions
- Actions
- Actions
- Actions
- Actions
- Actions
- Actions
- Actions
- Actions
- Actions
- Actions
- Actions
- Actions
- Actions
- Actions
- Actions
- Actions
- Actions
- Actions
- Actions
- Actions
- Actions
- Actions
- Actions
- Actions
- Actions
- Actions
- Actions
- Actions
- Actions
- Actions
- Actions
- Actions
- Actions
- Actions
- Actions
- Actions
- Actions
- Actions
- Actions
- Actions
- Actions
- Actions
- Actions
- Actions
- Actions
- Actions
- Actions
- Actions
- Actions
- Actions
- Actions
- Actions
- Actions
- Actions
- Actions
- Actions
- Actions
- Actions
- Actions
- Actions
- Actions
- Actions
- Actions
- Actions
- Actions
- Actions
- Actions
- Actions
- Actions
- Actions
- Actions
- Actions
- Actions
- Actions
- Actions
- Actions
- Actions
- Actions
- Actions
- Actions
- Actions
- Actions
- Actions
- Actions
- Actions
- Actions
- Actions
- Actions
- Actions
- Actions
- Actions
- Actions
- Actions
- Actions
- Actions
- Actions
- Actions
- Actions
- Actions
- Actions
- Actions
- Actions
- Actions
- Actions
- Actions
- Actions
- Actions
- Actions
- Actions
- Actions
- Actions
- Actions
- Actions
- Actions
- Actions
- Actions
- Actions
- Actions
- Actions
- Actions
- Actions
- Actions
- Actions
- Actions
- Actions
- Actions
- Actions
- Actions
- Actions
- Actions
- Actions
- Actions
- Actions
- Actions
- Actions
- Actions
- Actions
- Actions
- Actions
- Actions
- Actions
- Actions
- Actions
- Actions
- Actions
- Actions
- Actions
- Actions
- Actions
- Actions
- Actions
- Actions
- Actions
- Actions
- Actions
- Actions
- Actions
- Actions
- Actions
- Actions
- Actions
- Actions
- Actions
- Actions
- Actions
- Actions
- Actions
- Actions
- Actions
- Actions
- Actions
- Actions
- Actions
- Actions
- Actions
- Actions
- Actions
- Actions
- Actions
- Actions
- Actions
- Actions
- Actions
- Actions
- Actions
- Actions
- Actions
- Actions
- Actions
- Actions
- Actions
- Actions
- Actions
- Actions
- Actions
- Actions
- Actions
- Actions
- Actions
- Actions
- Actions
- Actions
- Actions
- Actions
- Actions
- Actions
- Actions
- Actions
- Actions
- Actions
- Actions
- Actions
- Actions
- Actions
- Actions
- Actions
- Actions
- Actions
- Actions
- Actions
- Actions
- Actions
- Actions
- Actions
- Actions
- Actions
- Actions
- Actions
- Actions
- Actions
- Actions
- Actions
- Actions
- Actions
- Actions
- Actions
- Actions
- Actions
- Actions
- Actions
- Actions
- Actions
- Actions
- Actions
- Actions
- Actions
- Actions
- Actions
- Actions
- Actions
- Actions
- Actions
- Actions
- Actions
- Actions
- Actions
- Actions
- Actions
- Actions
- Actions
- Actions
- Actions
- Actions
- Actions
- Actions
- Actions
- Actions
- Actions
- Actions
- Actions
- Actions
- Actions
- Actions
- Actions
- Actions
- Actions
- Actions
- Actions
- Actions
- Actions
- Actions
- Actions
- Actions
- Actions
- Actions
- Actions
- Actions
- Actions
- Actions
- Actions
- Actions
- Actions
- Actions
- Actions
- Actions
- Actions
- Actions
- Actions
- Actions
- Actions
- Actions
- Actions
- Actions
- Actions
- Actions
- Actions
- Actions
- Actions
- Actions
- Actions
- Actions
- Actions
- Actions
- Actions
- Actions
- Actions
- Actions
- Actions
- Actions
- Actions
- Actions
- Actions
- Actions
- Actions
- Actions
- Actions
- Actions
- Actions
- Actions
- Actions
- Actions
- Actions
- Actions
- Actions
- Actions
- Actions
- Actions
- Actions
- Actions
- Actions
- Actions
- Actions
- Actions
- Actions
- Actions
- Actions
- Actions
- Actions
- Actions
- Actions
- Actions
- Actions
- Actions
- Actions
- Actions
- Actions
- Actions
- Actions
- Actions
- Actions
- Actions
- Actions
- Actions
- Actions
- Actions
Grants and funding
LinkOut - more resources
Full Text Sources
Medical
Molecular Biology Databases
Research Materials
