

MicroRNA-9 inhibition of cell proliferation and identification of novel miR-9 targets by transcriptome profiling in breast cancer cells
- PMID: 22761433
- PMCID: PMC3436132
- DOI: 10.1074/jbc.M111.335943
MicroRNA-9 inhibition of cell proliferation and identification of novel miR-9 targets by transcriptome profiling in breast cancer cells
Abstract
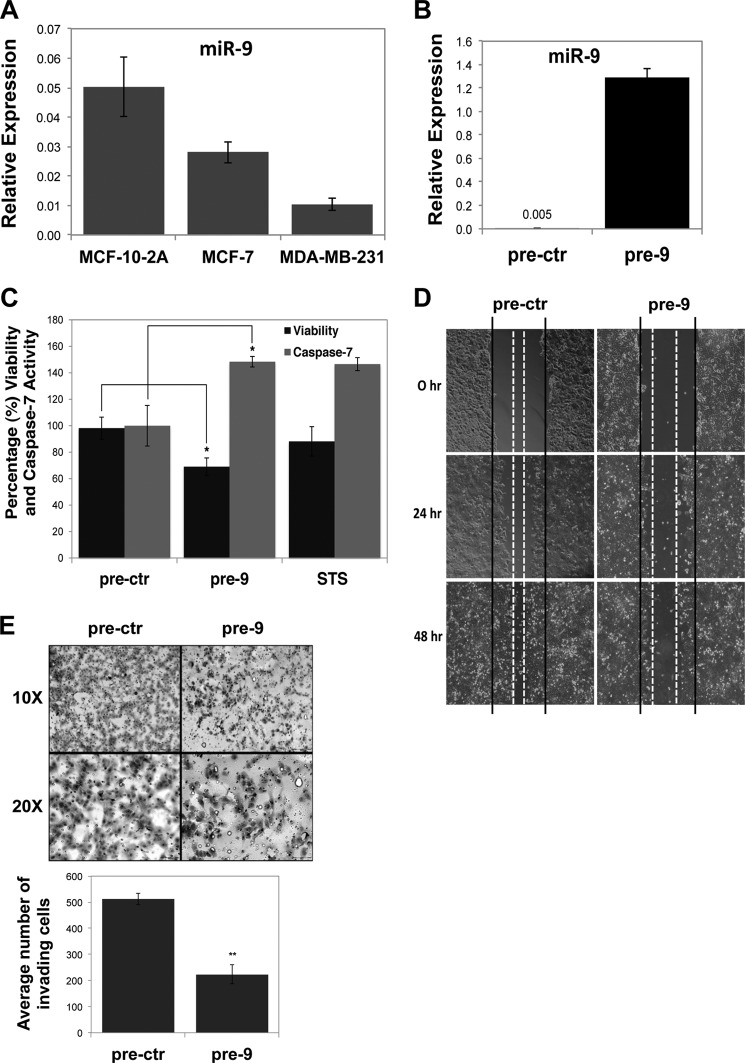
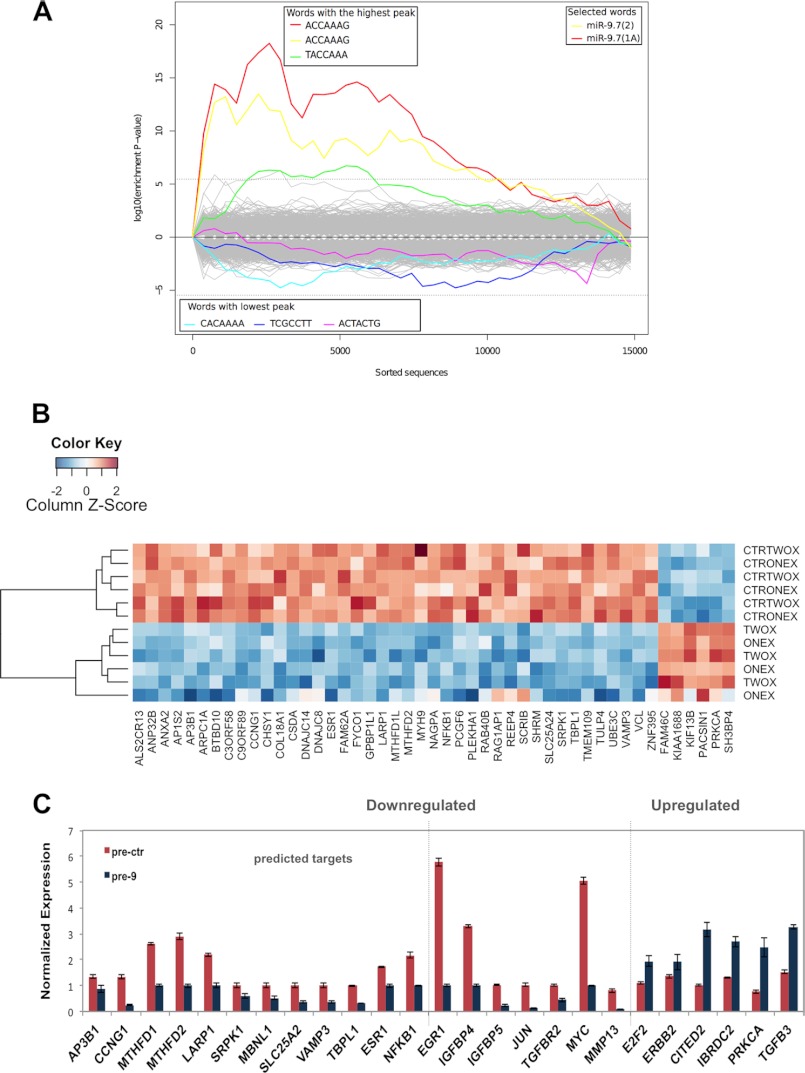
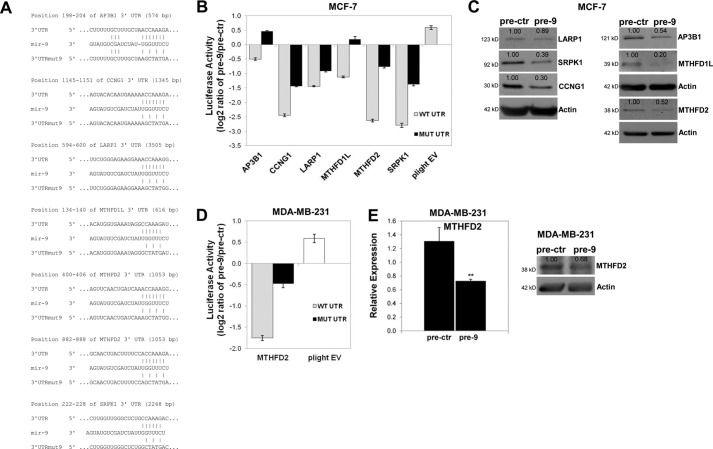
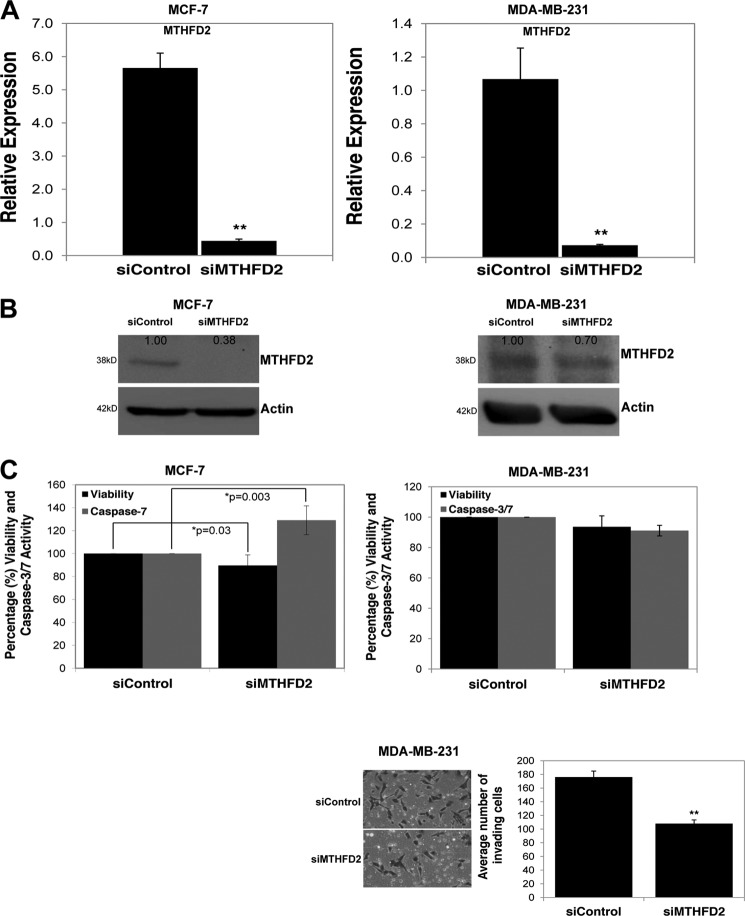
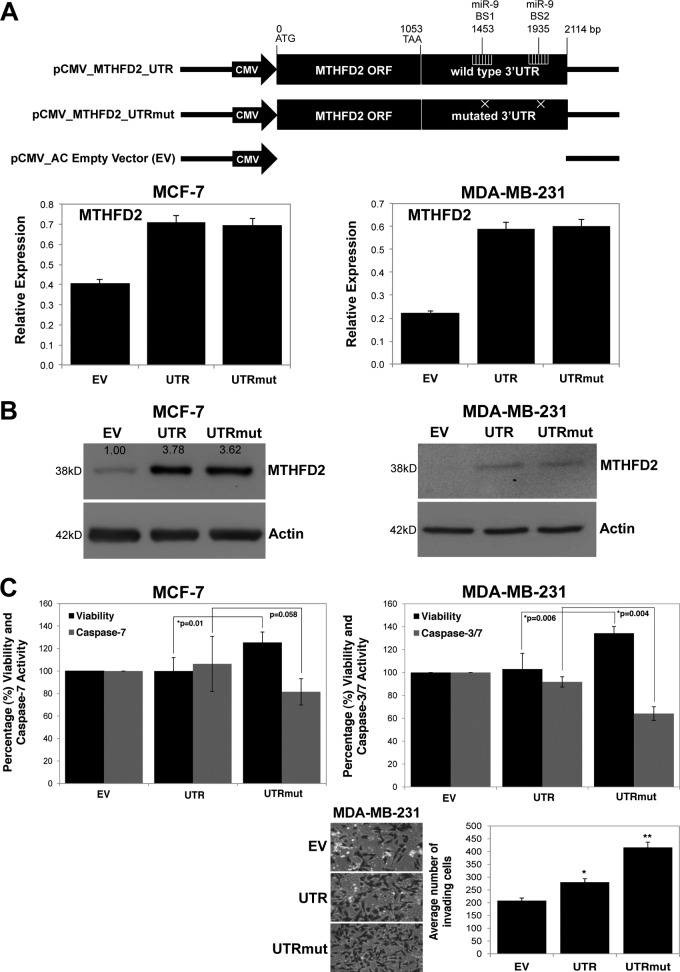
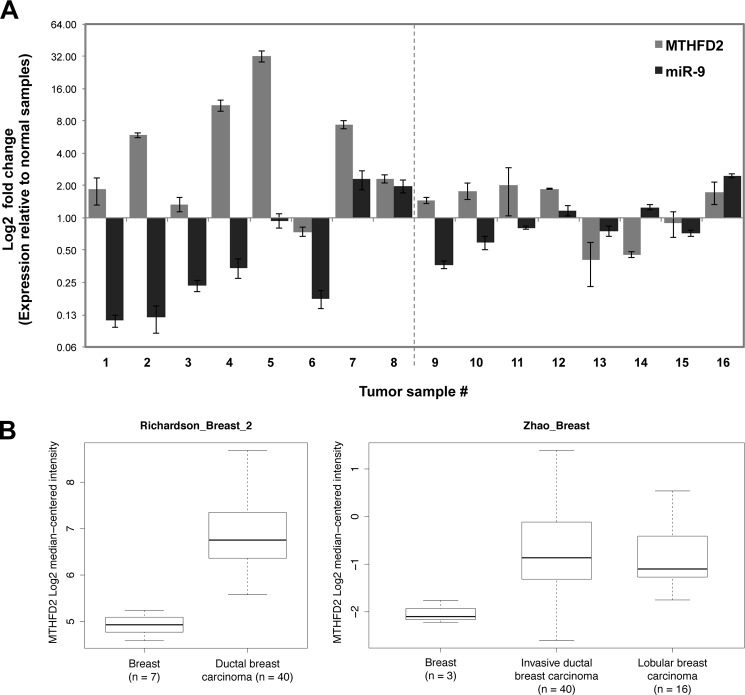
Although underexpression of miR-9 in cancer cells is reported in many cancer types, it is currently difficult to classify miR-9 as a tumor suppressor or an oncomir. We demonstrate that miR-9 expression is down-regulated in MCF-7 and MDA-MB-231 breast cancer cells compared with MCF-10-2A normal breast cell line. Increasing miR-9 expression levels in breast cancer cells induced anti-proliferative, anti-invasive, and pro-apoptotic activity. In addition, microarray profiling of the transcriptome of MCF-7 cells overexpressing miR-9 identified six novel direct miR-9 targets (AP3B1, CCNG1, LARP1, MTHFD1L, MTHFD2, and SRPK1). Among these, MTHFD2 was identified as a miR-9 target gene that affects cell proliferation. Knockdown of MTHFD2 mimicked the effect observed when miR-9 was overexpressed by decreasing cell viability and increasing apoptotic activity. Despite variable effects on different cell lines, proliferative and anti-apoptotic activity of MTHFD2 was demonstrated whereby it could escape from miR-9-directed suppression (by overexpression of MTHFD2 with mutated miR-9 binding sites). Furthermore, endogenous expression levels of miR-9 and MTHFD2 displayed inverse expression profiles in primary breast tumor samples compared with normal breast samples; miR-9 was down-regulated, and MTHFD2 was up-regulated. These results indicate anti-proliferative and pro-apoptotic activity of miR-9 and that direct targeting of MTHFD2 can contribute to tumor suppressor-like activity of miR-9 in breast cancer cells.
Figures
Similar articles
-
The overexpression of hypomethylated miR-663 induces chemotherapy resistance in human breast cancer cells by targeting heparin sulfate proteoglycan 2 (HSPG2).J Biol Chem. 2013 Apr 19;288(16):10973-85. doi: 10.1074/jbc.M112.434340. Epub 2013 Feb 22. J Biol Chem. 2013. PMID: 23436656 Free PMC article.
-
MiR-31 inhibits migration and invasion by targeting SATB2 in triple negative breast cancer.Gene. 2016 Dec 5;594(1):47-58. doi: 10.1016/j.gene.2016.08.057. Epub 2016 Sep 1. Gene. 2016. PMID: 27593563
-
A novel report of MiR-4301 induces cell apoptosis by negatively regulating DRD2 expression in human breast cancer cells.J Cell Biochem. 2018 Aug;119(8):6408-6417. doi: 10.1002/jcb.26577. Epub 2018 May 8. J Cell Biochem. 2018. PMID: 29236292
-
Down-regulation of lncRNA-ATB inhibits epithelial-mesenchymal transition of breast cancer cells by increasing miR-141-3p expression.Biochem Cell Biol. 2019 Apr;97(2):193-200. doi: 10.1139/bcb-2018-0168. Epub 2018 Oct 23. Biochem Cell Biol. 2019. PMID: 30352165
-
MicroRNA-335 suppresses the proliferation, migration, and invasion of breast cancer cells by targeting EphA4.Mol Cell Biochem. 2018 Feb;439(1-2):95-104. doi: 10.1007/s11010-017-3139-1. Epub 2017 Aug 9. Mol Cell Biochem. 2018. PMID: 28795314
Cited by
-
High-throughput RNAi screening for novel modulators of vimentin expression identifies MTHFD2 as a regulator of breast cancer cell migration and invasion.Oncotarget. 2013 Jan;4(1):48-63. doi: 10.18632/oncotarget.756. Oncotarget. 2013. PMID: 23295955 Free PMC article.
-
The Unique Biology behind the Early Onset of Breast Cancer.Genes (Basel). 2021 Mar 5;12(3):372. doi: 10.3390/genes12030372. Genes (Basel). 2021. PMID: 33807872 Free PMC article. Review.
-
Capturing the Mechanism Underlying TOP mRNA Binding to LARP1.Structure. 2019 Dec 3;27(12):1771-1781.e5. doi: 10.1016/j.str.2019.10.006. Epub 2019 Oct 31. Structure. 2019. PMID: 31676287 Free PMC article.
-
Tyrosinase-Based Reporter Gene for Photoacoustic Imaging of MicroRNA-9 Regulated by DNA Methylation in Living Subjects.Mol Ther Nucleic Acids. 2018 Jun 1;11:34-40. doi: 10.1016/j.omtn.2018.01.008. Epub 2018 Feb 13. Mol Ther Nucleic Acids. 2018. PMID: 29858069 Free PMC article.
-
More Than a Metabolic Enzyme: MTHFD2 as a Novel Target for Anticancer Therapy?Front Oncol. 2020 Apr 28;10:658. doi: 10.3389/fonc.2020.00658. eCollection 2020. Front Oncol. 2020. PMID: 32411609 Free PMC article. Review.
References
-
- Schickel R., Boyerinas B., Park S. M., Peter M. E. (2008) MicroRNAs. Key players in the immune system, differentiation, tumorigenesis, and cell death. Oncogene 27, 5959–5974 - PubMed
-
- Zhang B., Pan X., Cobb G. P., Anderson T. A. (2007) MicroRNAs as oncogenes and tumor suppressors. Dev. Biol. 302, 1–12 - PubMed
-
- Lu J., Getz G., Miska E. A., Alvarez-Saavedra E., Lamb J., Peck D., Sweet-Cordero A., Ebert B. L., Mak R. H., Ferrando A. A., Downing J. R., Jacks T., Horvitz H. R., Golub T. R. (2005) MicroRNA expression profiles classify human cancers. Nature 435, 834–838 - PubMed
-
- Ma L., Teruya-Feldstein J., Weinberg R. A. (2007) Tumorinvasion and metastasis initiated by microRNA-10b in breast cancer. Nature 449, 682–688 - PubMed
Publication types
MeSH terms
Substances
Associated data
- Actions
LinkOut - more resources
Full Text Sources
Other Literature Sources
Medical
Molecular Biology Databases
Research Materials
Miscellaneous
