. 2012 Aug 31;287(36):30664-76.
doi: 10.1074/jbc.M112.339127. Epub 2012 Jul 3.

Autophagy is a protective mechanism for human melanoma cells under acidic stress

Affiliations

Autophagy is a protective mechanism for human melanoma cells under acidic stress

Maria Lucia Marino et al. J Biol Chem. .

Abstract

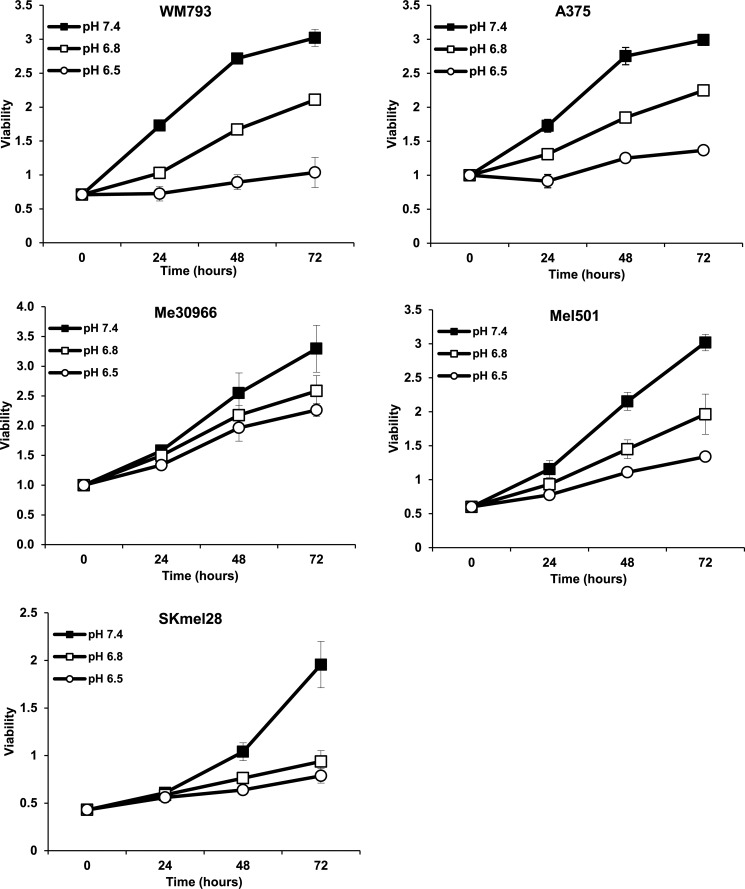
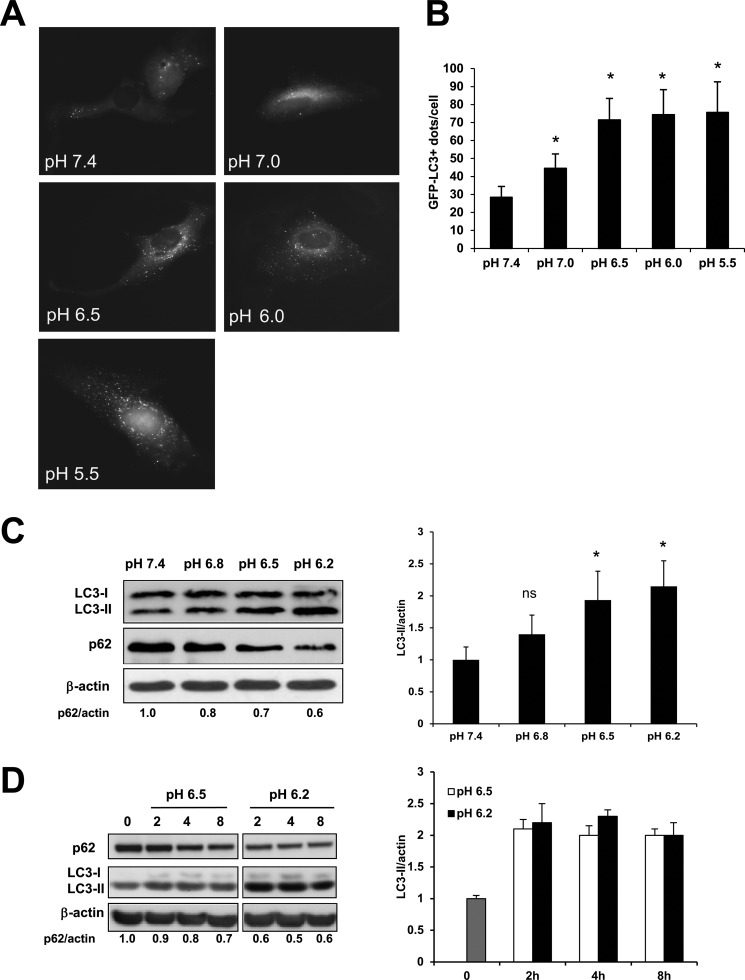
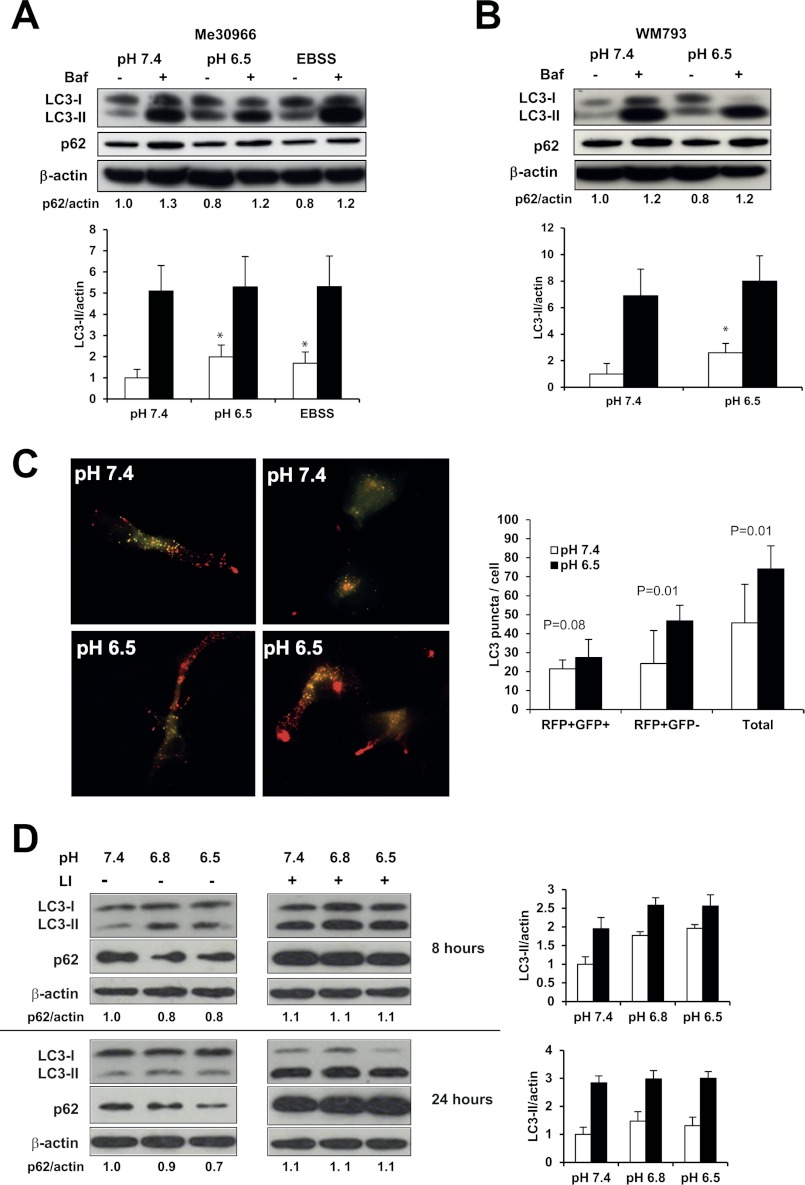
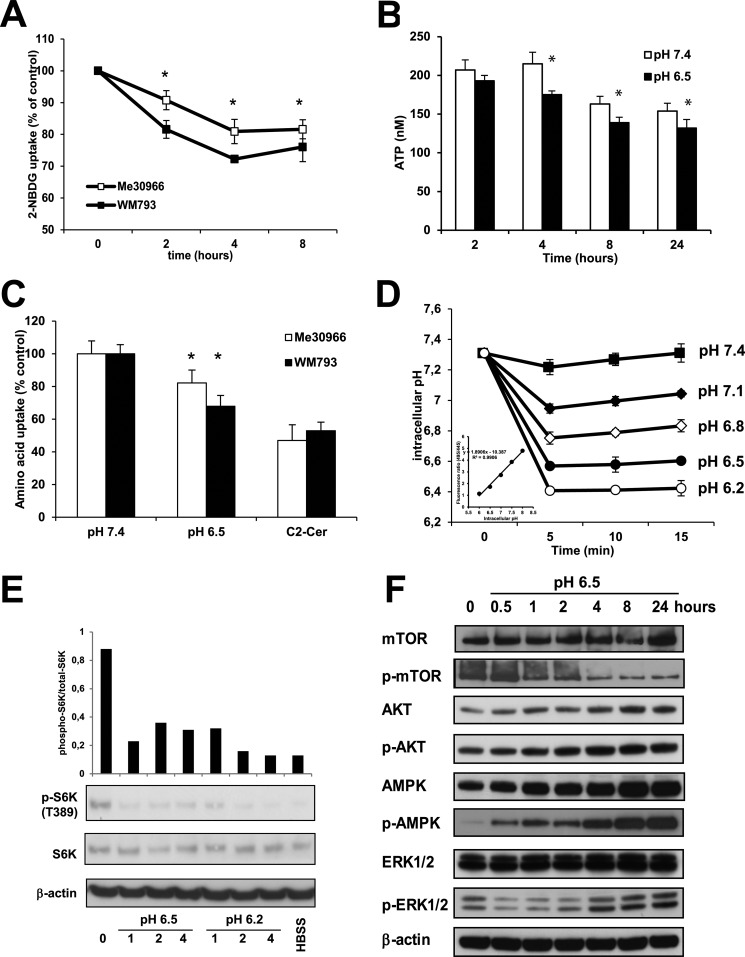
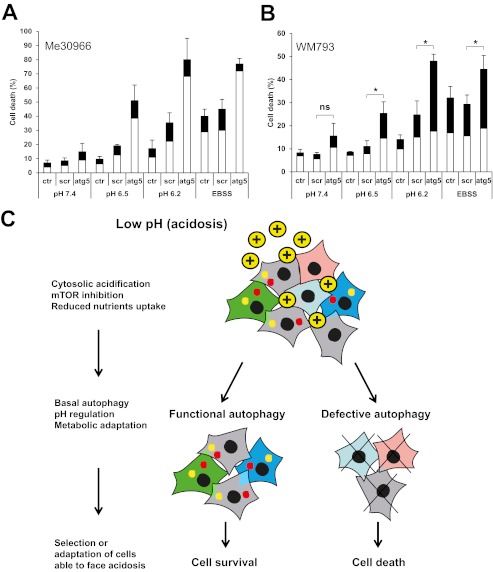
Cyclic hypoxia and alterations in oncogenic signaling contribute to switch cancer cell metabolism from oxidative phosphorylation to aerobic glycolysis. A major consequence of up-regulated glycolysis is the increased production of metabolic acids responsible for the presence of acidic areas within solid tumors. Tumor acidosis is an important determinant of tumor progression and tumor pH regulation is being investigated as a therapeutic target. Autophagy is a cellular catabolic pathway leading to lysosomal degradation and recycling of proteins and organelles, currently considered an important survival mechanism in cancer cells under metabolic stress or subjected to chemotherapy. We investigated the response of human melanoma cells cultured in acidic conditions in terms of survival and autophagy regulation. Melanoma cells exposed to acidic culture conditions (7.0 < pH < 6.2) promptly accumulated LC3+ autophagic vesicles. Immunoblot analysis showed a consistent increase of LC3-II in acidic culture conditions as compared with cells at normal pH. Inhibition of lysosomal acidification by bafilomycin A1 further increased LC3-II accumulation, suggesting an active autophagic flux in cells under acidic stress. Acute exposure to acidic stress induced rapid inhibition of the mammalian target of rapamycin signaling pathway detected by decreased phosphorylation of p70S6K and increased phosphorylation of AMP-activated protein kinase, associated with decreased ATP content and reduced glucose and leucine uptake. Inhibition of autophagy by knockdown of the autophagic gene ATG5 consistently reduced melanoma cell survival in low pH conditions. These observations indicate that induction of autophagy may represent an adaptation mechanism for cancer cells exposed to an acidic environment. Our data strengthen the validity of therapeutic strategies targeting tumor pH regulation and autophagy in progressive malignancies.


Figures

FIGURE 1.
FIGURE 1.
Human melanoma cells slowly proliferate under acidic stress. The human melanoma cell lines WM793, A375, Me30966, Mel501, and SK-Mel-28 were cultured over 3 days at different pHe conditions. Cell viability was measured every day with the acid phosphatase assay. Data from two independent experiments run in triplicate wells are shown. Data are expressed as mean ± S.D.
FIGURE 2.
FIGURE 2.
Autophagy response in melanoma cells upon acidic stress. A and B, Me30966 cells transiently transfected with GFP-LC3 plasmid were exposed for 8 h to media at different pH values. The presence of GFP-LC3+ dots was observed by fluorescence microscopy and quantified. C, Me30966 cells were exposed to different acidic media for 8 h and LC3 and p62 expression was evaluated by Western blot. The expression of LC3 was measured by gel densitometry using Adobe Photoshop Elements 9 and normalized to the pH 7.4 condition. D, Me30966 cells were plated overnight and culture medium was changed to pH 6.5 and 6.2. Cells were collected at time 0 (gray bar) and 2, 4, and 8 h after medium change. Expression of p62 and LC3 was analyzed by Western blot and normalized to the values at time 0. All blots shown are representative of at least two independent experiments. Where shown, * indicates p < 0.05.
FIGURE 3.
FIGURE 3.
Autophagic flux in melanoma cells under acidic stress. A, analysis of autophagic flux in Me30966 (A) and WM793 (B) cells was performed by evaluating the expression levels of LC3 and p62 in cells cultured in the specified pH conditions in the presence or absence of Bafilomycin A1 (30 nm) for 8 h. C, the presence of autophagosomes and autolysosomes was analyzed in Me30966 cells transfected with GFP-RFP-LC3 plasmid and observed after 8 h incubation with medium at pH 7.4 or 6.5. D, the autophagic flux was analyzed in Me30966 cells after short-term (8 h) and long-term (24 h) exposure to acidic stress in presence or absence of lysosomal inhibitors. Similar results were observed in 2 to 4 independent experiments. Where shown, * indicates p < 0.05.
FIGURE 4.
FIGURE 4.
Effects of acidic stress on nutrients uptake and mTOR signaling. A, WM793 and Me30966 cells were exposed to pH 7.4 or 6.5 and the uptake of 2-NBDG was analyzed over time. The * shows a p < 0.05 for differences between cells cultured in acidic conditions and cells cultured at pH 7.4. B, Me30966 cells were exposed to pH 7.4 and 6.5 and cellular ATP concentration was determined over time and normalized to 100 cells. The experiments were run three times in six replicates, where * shows a p < 0.05. C, Me30966 and WM793 cells were exposed to medium at different pH values (7.4 and 6.5) or to C2-Cer (50 μm) for 4 h and the uptake of [3H]leucine was measured. The bars represent the mean ± S.D. of two experiments run in triplicate, where * shows a p < 0.05. D, the effect of medium at different pHe on intracellular pH was evaluated in A375 cells. The inset shows a representative standard curve by a ratiometric fluorescence method using BCECF. Representative data of two independent experiments run in triplicate wells are shown. E, the expression of total and phosphorylated p70S6K in Me30966 cells exposed to pH 6.5 and 6.2 was evaluated over time (hours) by Western blot and measured by densitometry using Adobe Photoshop Elements 9. F, the status of mTOR upstream signaling was analyzed in Me30966 cells exposed to pH 6.5 media at different time points (up to 24 h) by analyzing the phosphorylation of ERK, AKT, AMPK, and mTOR. The blots shown are representative of three different experiments with similar results.
FIGURE 5.
FIGURE 5.
Autophagy protects melanoma cells following acidic stress. Me30966 cells (A) and WM793 cells (B) were transfected with siRNA for human ATG5 gene and cell death was measured 24 h after exposing the cells to different pH conditions (pH 7.4, pH 6.5, and pH 6.2). Cells exposed to nutrient starvation (EBSS) were used as positive control. Cell death is expressed as the mean percentage of apoptotic (white bars) and necrotic (black bars). Mean ± S.D. of three experiments run in duplicate wells are shown, where * shows a p < 0.05. The p value was calculated for differences between the cells treated with scrambled and ATG5-specific siRNA (paired t test). C, schematic representation of a possible model linking autophagy and acidic pH in melanoma.

Similar articles

Cited by

References

    1. Cairns R. A., Harris I. S., Mak T. W. (2011) Regulation of cancer cell metabolism. Nat. Rev. Cancer 11, 85–95 - PubMed
    1. Chiche J., Brahimi-Horn M. C., Pouysségur J. (2010) Tumor hypoxia induces a metabolic shift causing acidosis. A common feature in cancer. J. Cell Mol. Med. 14, 771–794 - PMC - PubMed
    1. Warburg O. (1956) On the origin of cancer cells. Science 123, 309–314 - PubMed
    1. Gatenby R. A., Gillies R. J. (2004) Why do cancers have high aerobic glycolysis? Nat. Rev. Cancer 4, 891–899 - PubMed
    1. Gillies R. J., Robey I., Gatenby R. A. (2008) Causes and consequences of increased glucose metabolism of cancers. J. Nucl. Med. 49, 24S-42S - PubMed

Publication types

Substances