. 2012 Aug 17;287(34):28508-17.
doi: 10.1074/jbc.M112.356634. Epub 2012 Jul 3.

Conditional inactivation of Blimp1 in adult mice promotes increased bone mass

Affiliations

Conditional inactivation of Blimp1 in adult mice promotes increased bone mass

Yoshiteru Miyauchi et al. J Biol Chem. .

Abstract

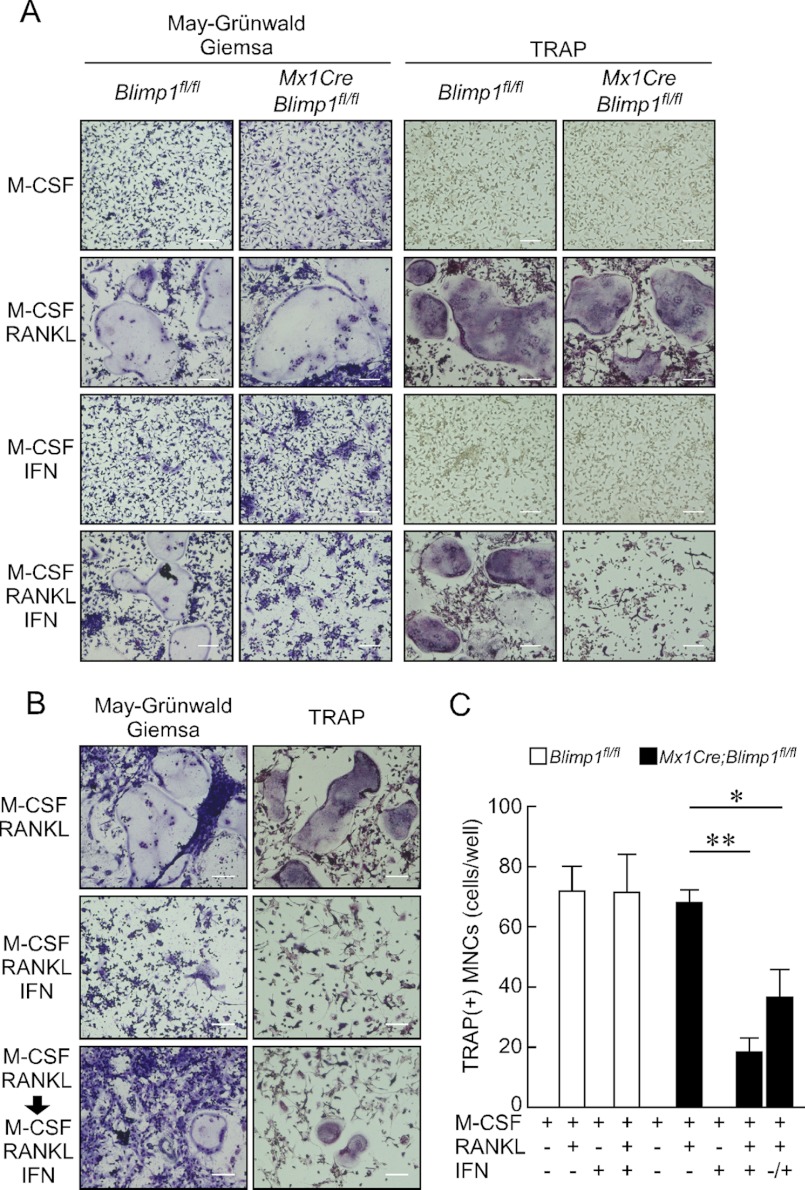
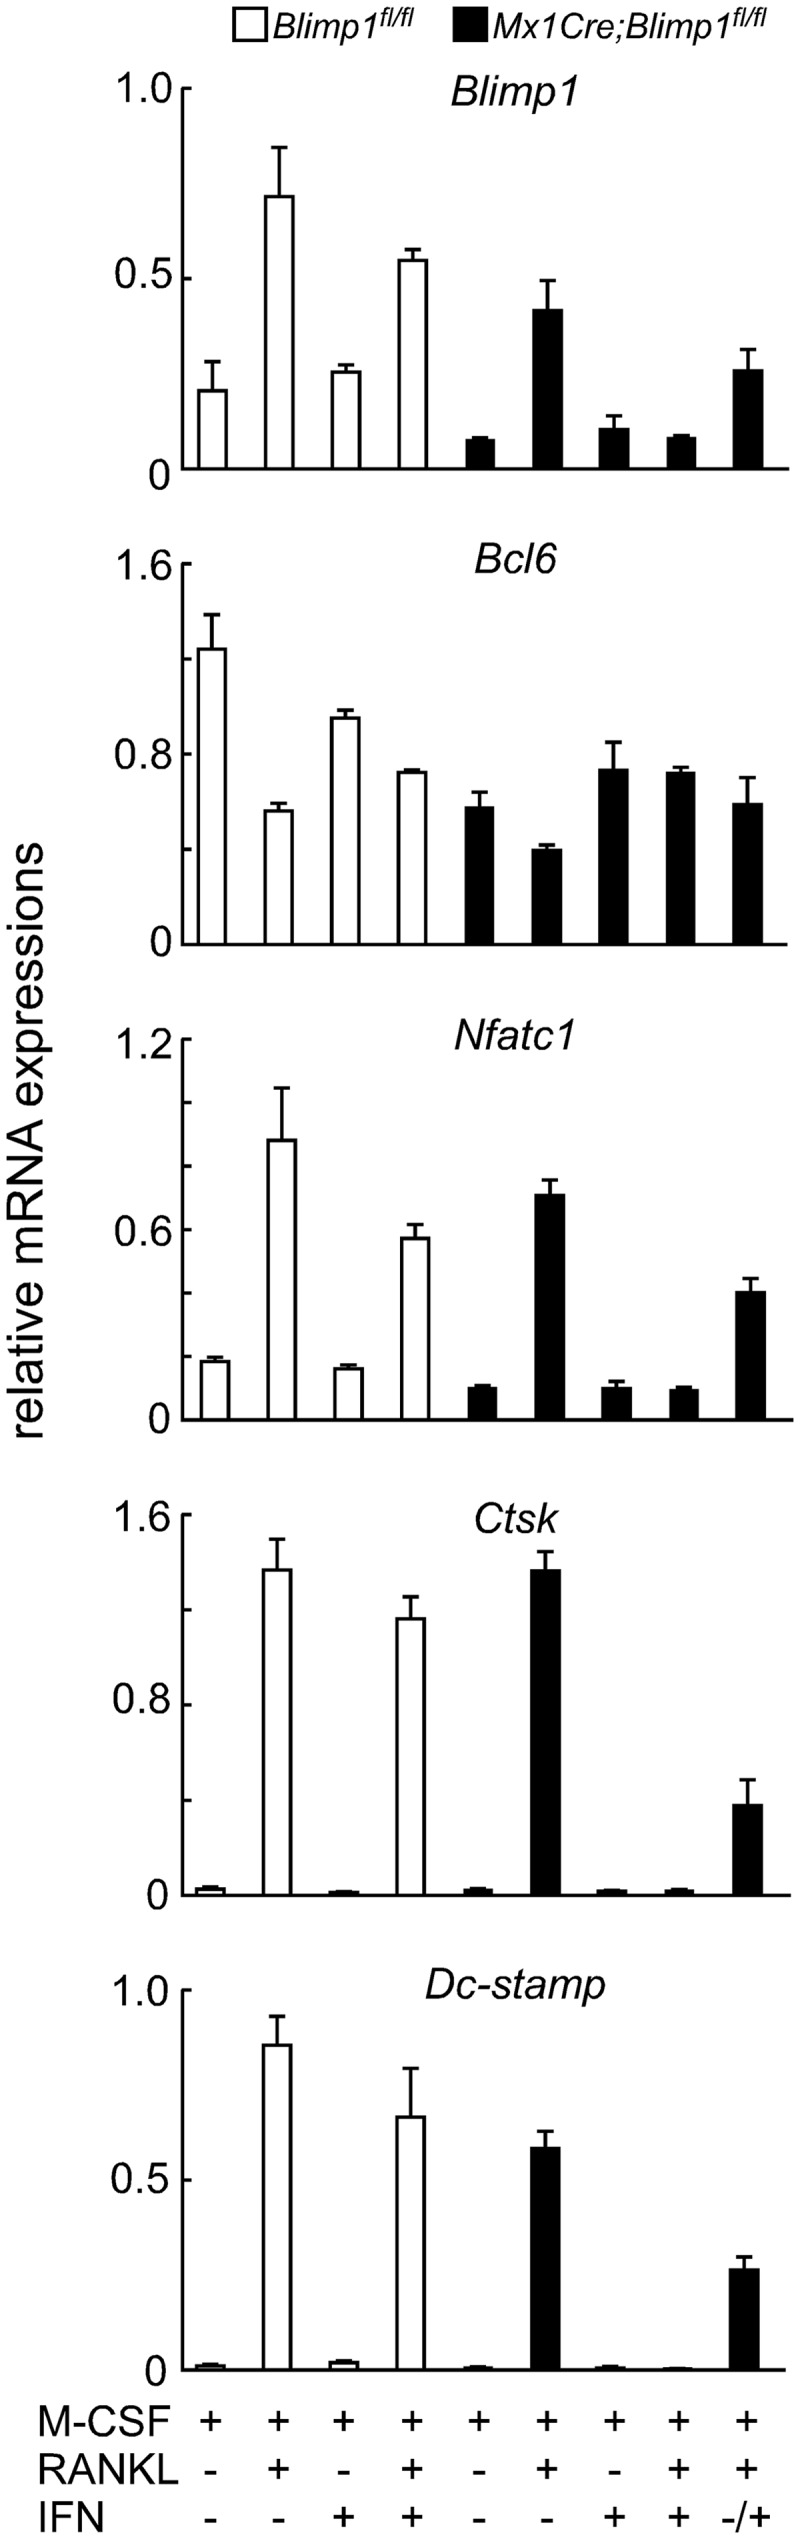
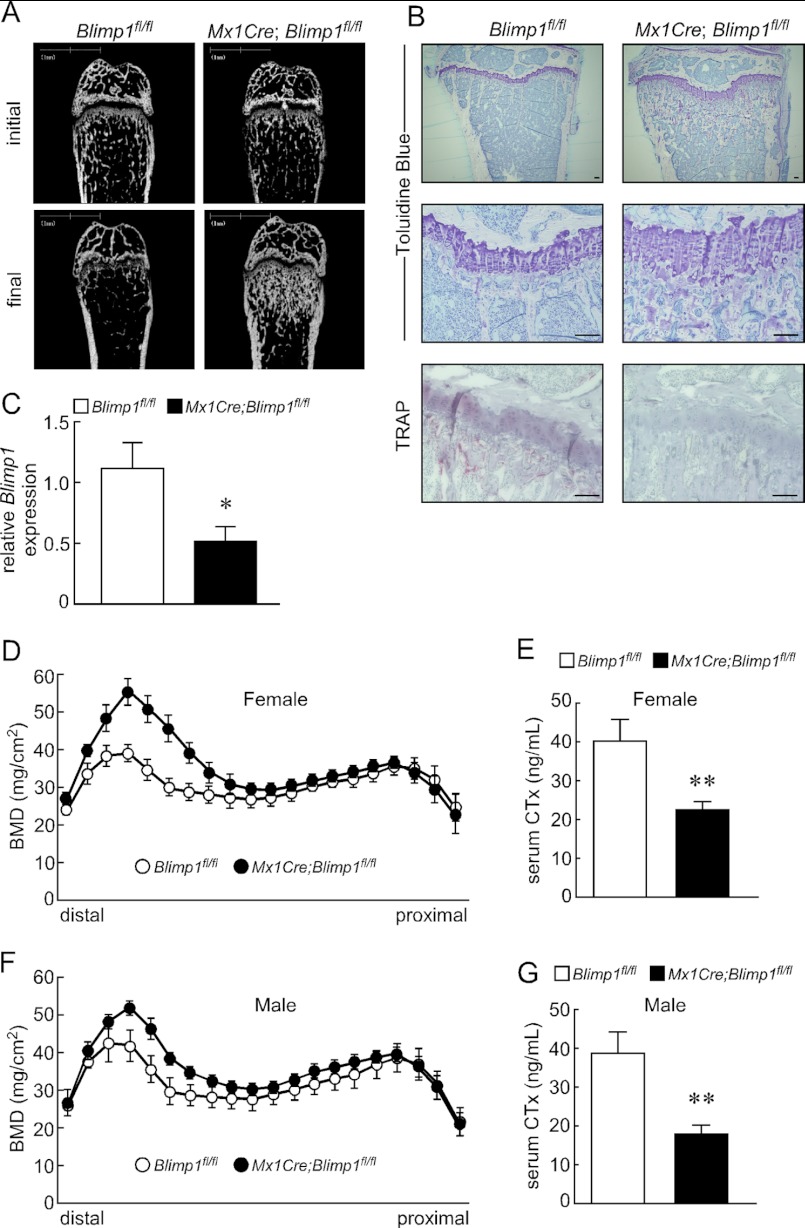
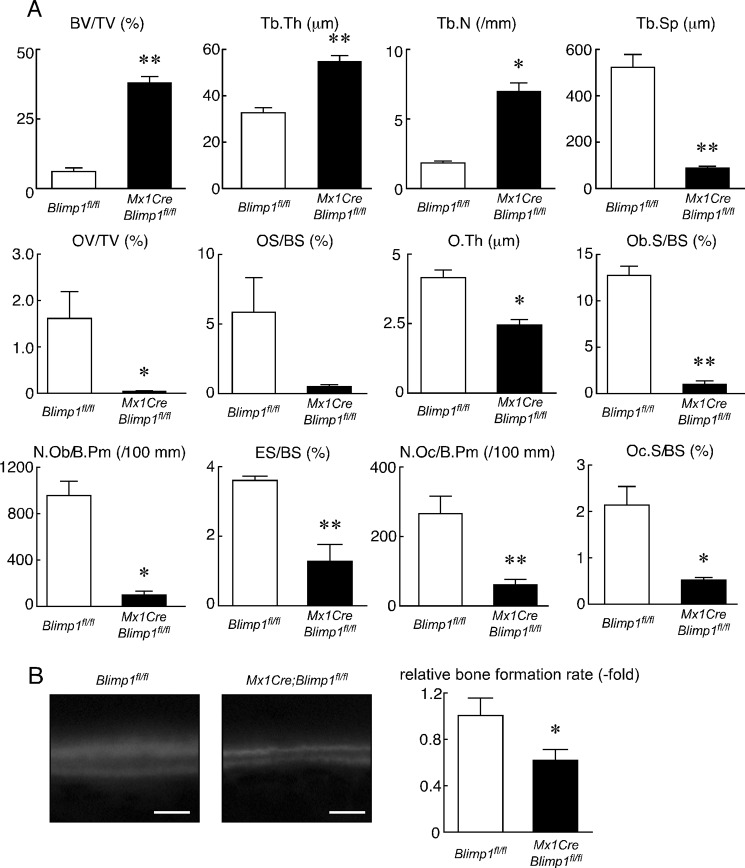
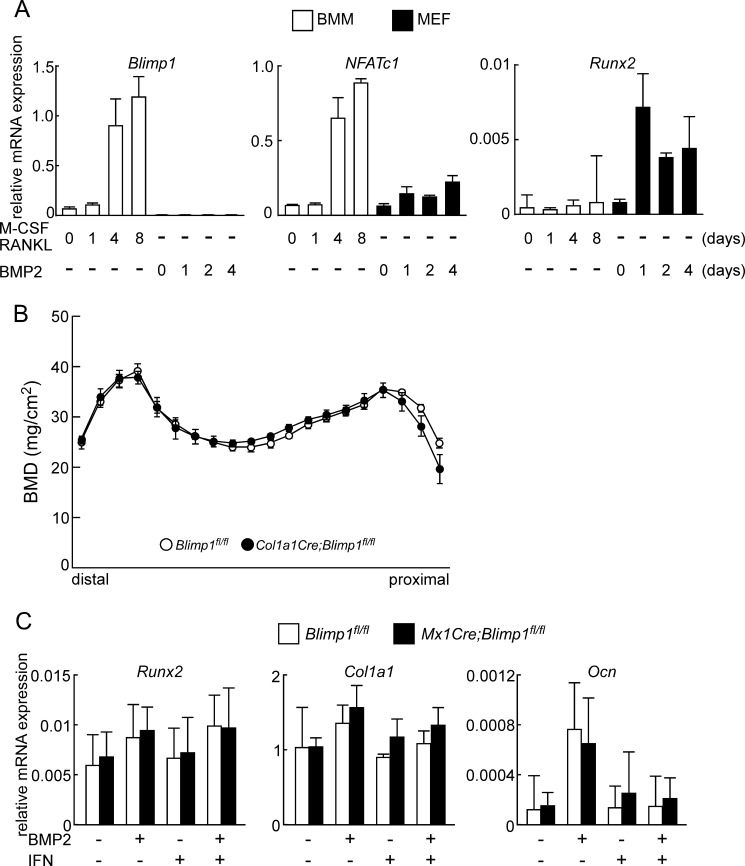
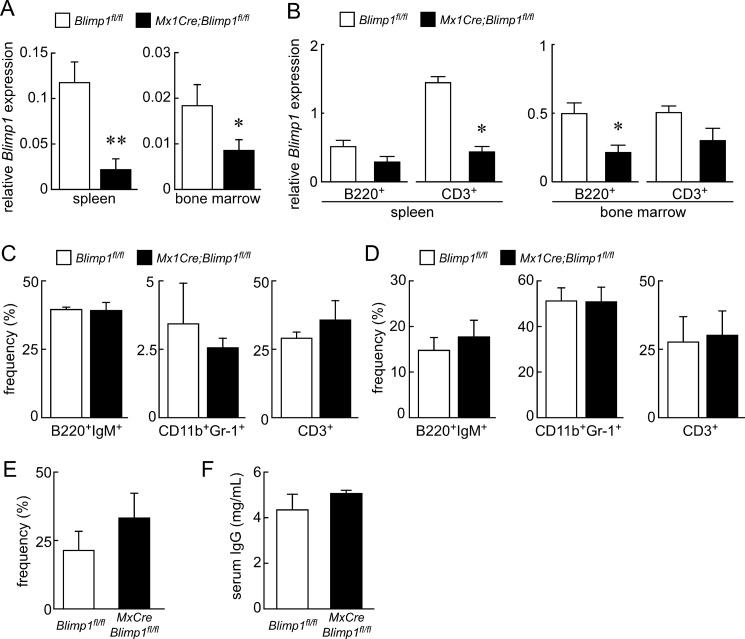
Bone resorption, which is regulated by osteoclasts, is excessively activated in bone destructive diseases such as osteoporosis. Thus, controlling osteoclasts would be an effective strategy to prevent pathological bone loss. Although several transcription factors that regulate osteoclast differentiation and function could serve as molecular targets to inhibit osteoclast formation, those factors have not yet been characterized using a loss of function approach in adults. Here we report such a study showing that inactivation of B-lymphocyte induced maturation protein 1 (Blimp1) in adult mice increases bone mass by suppressing osteoclast formation. Using an ex vivo assay, we show that osteoclast differentiation is significantly inhibited by Blimp1 inactivation at an early stage of osteoclastogenesis. Conditional inactivation of Blimp1 inhibited osteoclast formation and increased bone mass in both male and female adult mice. Bone resorption parameters were significantly reduced by Blimp1 inactivation in vivo. Blimp1 reportedly regulates immune cell differentiation and function, but we detected no immune cell failure following Blimp1 inactivation. These data suggest that Blimp1 is a potential target to promote increased bone mass and prevent osteoclastogenesis.


Figures

FIGURE 1.
FIGURE 1.
Blimp1 inactivation impairs osteoclast differentiation. Bone marrow cells prepared from Blimp1fl/fl and Mx1Cre;Blimp1fl/fl mice were subjected to osteoclast formation in vitro. A, osteoclast precursor cells pre-treated with IFN (100 units/ml) were cultured for 5 days and subjected to May-Grünwald Giemsa and TRAP staining to assess osteoclast differentiation. Bar, 100 μm. B, osteoclast precursor cells were cultured for 5 days with or without IFN and subjected to similar analysis after RANKL stimulation. Bars: 100 μm. C, number of TRAP-positive cells containing more than three nuclei was scored. White (Blimp1fl/fl) and black (Mx1Cre;Blimp1fl/fl) bars indicate means ± S.D. (**, p < 0.001; n = 3).
FIGURE 2.
FIGURE 2.
Blimp1 inactivation inhibits expression of osteoclast-specific genes. Bone marrow cells prepared from Blimp1fl/fl (white bars) and Mx1Cre;Blimp1fl/fl (black bars) mice were cultured in the presence or absence of RANKL with or without IFN for 5 days. Gene expression was analyzed by qPCR. Data represent mean expression of indicated gene relative to Actb ± S.D. (n = 3).
FIGURE 3.
FIGURE 3.
Conditional inactivation of Blimp1 increases bone volume. A, micro CT analysis of femurs of Blimp1fl/fl and Mx1Cre;Blimp1fl/fl female mice before (initial) and 5 weeks after (final) pI-pC injection. Bars: 1 mm. B, longitudinal sections of tibias of Blimp1fl/fl and Mx1Cre;Blimp1fl/fl female mice were stained with toluidine blue and TRAP activity and shown by low and high magnification. Bars: 100 μm. C, qPCR analysis of Blimp1 in long bones of Blimp1fl/fl and Mx1Cre;Blimp1fl/fl female mice treated with pI-pC. Bars indicate mean expression relative to Actb ± S.D. (n = 3). D and F, BMD of equal longitudinal division of femurs of Blimp1fl/fl and Mx1Cre;Blimp1fl/fl mice. Data are means ± S.D. (n = 5 mice/group). Female and male BMD are shown in D and F, respectively. E and G, serum CTx levels in Blimp1fl/fl (white bars) and Mx1Cre;Blimp1fl/fl (black bars) mice. Bars indicate mean serum CTx (ng/ml) ± S.D. (**, p < 0.001; n = 5 mice/group). Female and male Serum CTx levels are shown in E and G, respectively. Analyses were undertaken 5 weeks after completion of pI-pC injections (B–G).
FIGURE 4.
FIGURE 4.
Conditional inactivation of Blimp1 alters bone resorption and formation parameters. A, bone histomorphometrical analysis of femurs of Blimp1fl/fl (white bars) and Mx1Cre;Blimp1fl/fl (black bars) female mice 5 weeks after pI-pC injection. Data represent the mean value of the indicated parameter ± S.D. (*, p < 0.01; **, p < 0.001; n = 5 mice/group). B, left panel, Calcein-labeled bones were observed under a fluorescence microscope. Bars: 10 μm. Right panel, white (Blimp1fl/fl) and black (Mx1Cre;Blimp1fl/fl) bars indicate mean relative bone formation rate ± S.D. (*, p < 0.01; n = 5).
FIGURE 5.
FIGURE 5.
Blimp1 expression is crucial for osteoclastogenesis. A, BMMs (white bars) and MEFs (black bars) prepared from wild type mice were subjected to osteoclastogenic or osteoblastogenic culture, respectively, followed by qPCR analysis. Bars indicate mean expression of indicated genes relative to Actb ± S.D. (n = 3). B, BMD of equal longitudinal division of femurs of Blimp1fl/fl and Col1a1Cre;Blimp1fl/fl mice. Data are means ± S.D. (n = 5 mice/group). C, mouse primary osteoblasts from Blimp1fl/fl (white bars) and Mx1Cre;Blimp1fl/fl (black bars) were cultured in indicated conditions for 3 days and then subjected to qPCR analysis. Bars indicate mean expression of indicated genes relative to Actb ± S.D. (n = 3).
FIGURE 6.
FIGURE 6.
Immune cells are maintained after Blimp1 inactivation in adults. Spleen and bone marrow cells from Blimp1fl/fl (white bars) and Mx1Cre;Blimp1fl/fl (black bars) female mice 5 weeks after pI-pC injection were analyzed. A, Blimp1 mRNA levels in spleen and bone marrow. B, Blimp1 mRNA levels in B220+ and CD3+ cells sorted from spleen and bone marrow. qPCR data represent mean expression relative to Actb ± S.D. (*, p < 0.01; n = 3). C and D, flow cytometric analysis of B220+IgM+, CD11b+Gr-1+ and CD3+ cells in spleen and bone marrow cells. Data for spleen and bone marrow cells are shown in C and D, respectively. E, flow cytometric analysis of osteoclast progenitors (c-Kit+CD11clowc-Fms+ cells) in bone marrow cells. F, serum IgG levels were determined by ELISA. Bars indicate mean serum IgG levels (mg/ml) ± S.D. (*, p < 0.01; **, p < 0.001; n = 3 mice/group).

Similar articles

Cited by

References

    1. Karsenty G., Wagner E. F. (2002) Reaching a genetic and molecular understanding of skeletal development. Dev. Cell 2, 389–406 - PubMed
    1. Rodan G. A., Martin T. J. (2000) Therapeutic approaches to bone diseases. Science 289, 1508–1514 - PubMed
    1. Kong Y. Y., Yoshida H., Sarosi I., Tan H. L., Timms E., Capparelli C., Morony S., Oliveira-dos-Santos A. J., Van G., Itie A., Khoo W., Wakeham A., Dunstan C. R., Lacey D. L., Mak T. W., Boyle W. J., Penninger J. M. (1999) OPGL is a key regulator of osteoclastogenesis, lymphocyte development and lymph-node organogenesis. Nature 397, 315–323 - PubMed
    1. Nakashima T., Takayanagi H. (2009) Osteoclasts and the immune system. J. Bone Miner. Metab. 27, 519–529 - PubMed
    1. Yagi M., Miyamoto T., Sawatani Y., Iwamoto K., Hosogane N., Fujita N., Morita K., Ninomiya K., Suzuki T., Miyamoto K., Oike Y., Takeya M., Toyama Y., Suda T. (2005) DC-STAMP is essential for cell-cell fusion in osteoclasts and foreign body giant cells. J. Exp. Med. 202, 345–351 - PMC - PubMed

Substances