

Use it and improve it or lose it: interactions between arm function and use in humans post-stroke
- PMID: 22761551
- PMCID: PMC3385844
- DOI: 10.1371/journal.pcbi.1002343
Use it and improve it or lose it: interactions between arm function and use in humans post-stroke
Abstract
"Use it and improve it, or lose it" is one of the axioms of motor therapy after stroke. There is, however, little understanding of the interactions between arm function and use in humans post-stroke. Here, we explored putative non-linear interactions between upper extremity function and use by developing a first-order dynamical model of stroke recovery with longitudinal data from participants receiving constraint induced movement therapy (CIMT) in the EXCITE clinical trial. Using a Bayesian regression framework, we systematically compared this model with competitive models that included, or not, interactions between function and use. Model comparisons showed that the model with the predicted interactions between arm function and use was the best fitting model. Furthermore, by comparing the model parameters before and after CIMT intervention in participants receiving the intervention one year after randomization, we found that therapy increased the parameter that controls the effect of arm function on arm use. Increase in this parameter, which can be thought of as the confidence to use the arm for a given level of function, lead to increase in spontaneous use after therapy compared to before therapy.
Conflict of interest statement
The authors have declared that no competing interests exist.
Figures
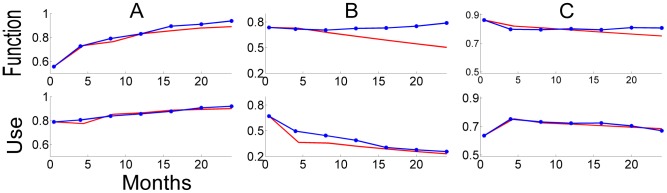
 = 0.76,
  = 2.98 and
  = 0.42) (B) Arm function is more or less constant, while arm use shows “non-use” (mean model parameters
  = 0.14,
  = 3.36 and
  = 3.03). (C) Arm function slightly decreases, while arm use rises after 4 month and keeps the level (mean model parameters
  = 0.19,
  = 3.48 and
  = 1.88). See how the model fit is in general good for use over the 24 months and for function in the first year but then is getting worse for function in the second year (see Table 3 and 4 for a systematic evaluation of model fit).
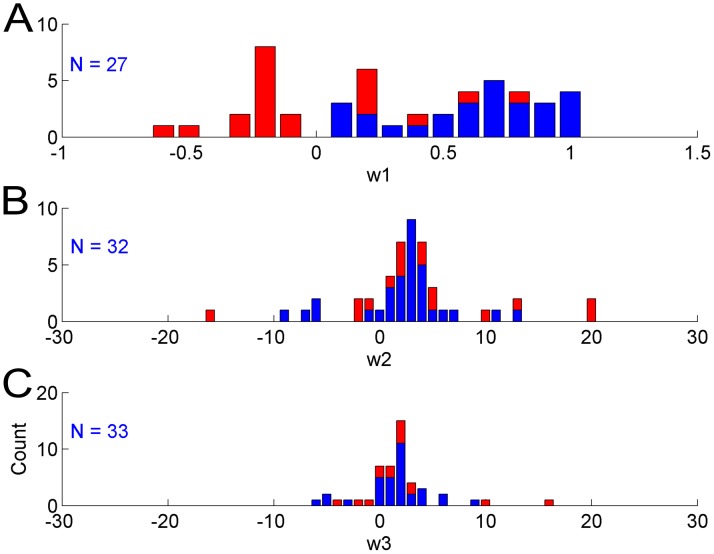
 ,
,
 , and
, and
 of the model estimated with data of the immediate group in the EXCITE trial. Blue and Red: subjects with all estimated mean parameters. Blue: subjects with mean parameters after application of convergence criteria (see Results). The numbers N's indicate the numbers of subjects with good convergence for each parameter. Note that for
  , the means of all parameters with good convergence are in the range [0; 1] supporting the “Use it and improve it, or lose it” model. Similarly, for
  , the means of most parameters with good convergence are positive, supporting an actual influence of function on use (Refer to Equation (1) and (2) in Methods for the role of these parameters in the model).
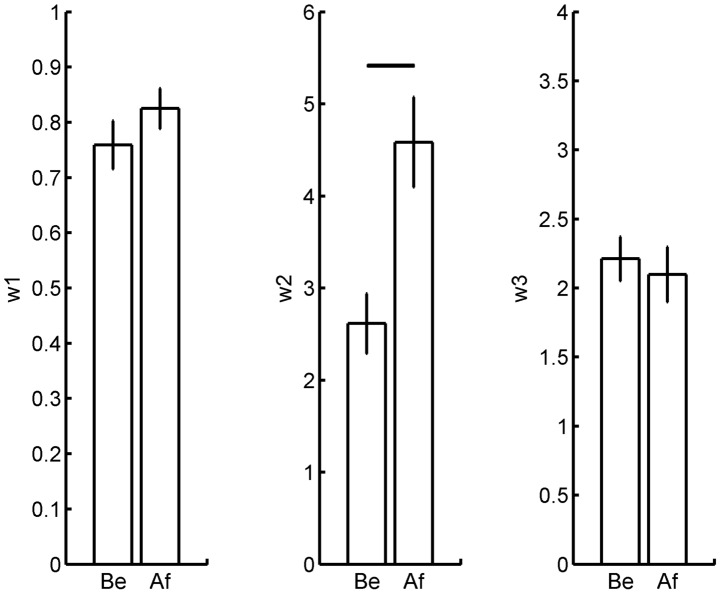
 . B. Effect on
  . C. Effect on
  . Only the mean parameter
  of equation 2 varies from before (Be) to after (Af) therapy. This parameter controls the effect of function on use for the affected arm. The horizontal line in B indicates p<0.05.
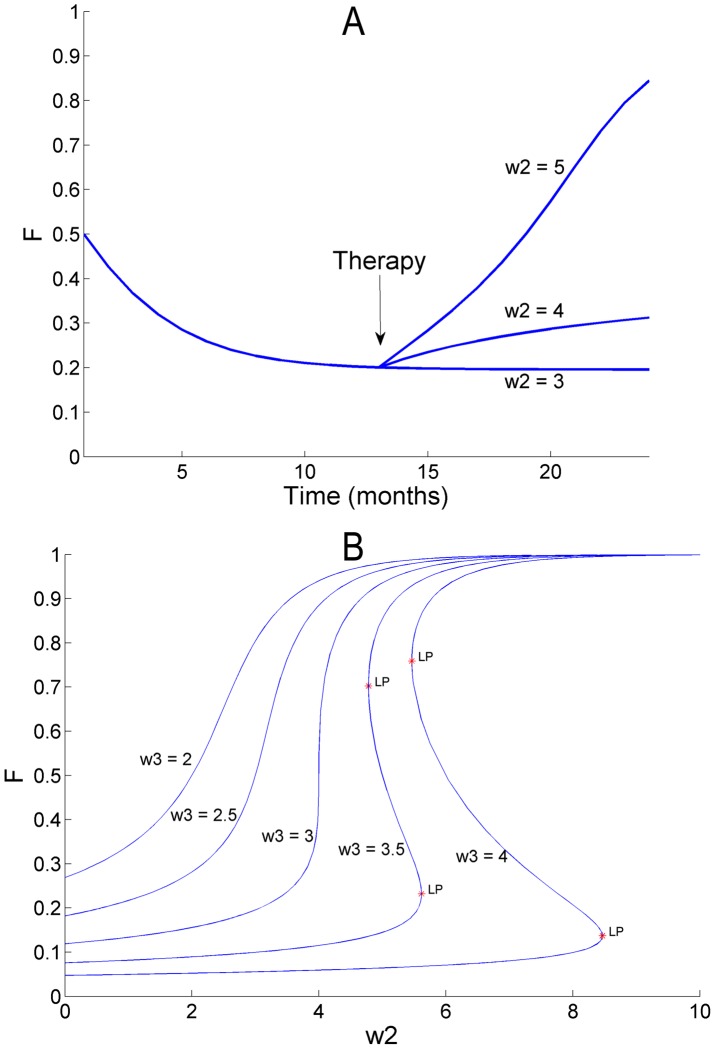
 as a result of therapy. Initial parameters values:
  = 0.6,
  = 3,
= 3,  = 3. For simplicity, we assumed here that therapy has only an effect on the parameter
  and not on use and performance (which it did in actual participants of the EXCITE trial [3]). The increase in parameter
  from before to after therapy parallels the increase in this parameter in the delayed group of the EXCITE trial (see Figure 4). B. Parameter sensitivity analysis showing the asymptotic value of arm function F as a function of parameter
  for a number of values of
  . LP: limit point. The line labeled
  = 3 is generated by the same model as in A. For values of
  >3 the system behavior exhibits a non-stable range between the two limit points. For
  = 3.5 and
  = 5 for instance, arm function F converges to either a low or a high value.
References
-
- Nakayama H, Jorgensen HS, Raaschou HO, Olsen TS. Compensation in recovery of upper extremity function after stroke: the Copenhagen Stroke Study. Arch Phys Med Rehabil. 1994;75:852–857. - PubMed
-
- Mayo NE, Wood-Dauphinee S, Cote R, Durcan L, Carlton J. Activity, participation, and quality of life 6 months poststroke. Arch Phys Med Rehabil. 2002;83:1035–1042. - PubMed
-
- Wolf SL, Winstein CJ, Miller JP, Taub E, Uswatte G, et al. Effect of constraint-induced movement therapy on upper extremity function 3 to 9 months after stroke: the EXCITE randomized clinical trial. Jama. 2006;296:2095–2104. - PubMed
-
- Butefisch C, Hummelsheim H, Denzler P, Mauritz KH. Repetitive training of isolated movements improves the outcome of motor rehabilitation of the centrally paretic hand. J Neurol Sci. 1995;130:59–68. - PubMed
Publication types
MeSH terms
Grants and funding
LinkOut - more resources
Full Text Sources
Medical
Molecular Biology Databases
