

Simple epidemiological dynamics explain phylogenetic clustering of HIV from patients with recent infection
- PMID: 22761556
- PMCID: PMC3386305
- DOI: 10.1371/journal.pcbi.1002552
Simple epidemiological dynamics explain phylogenetic clustering of HIV from patients with recent infection
Abstract
Phylogenies of highly genetically variable viruses such as HIV-1 are potentially informative of epidemiological dynamics. Several studies have demonstrated the presence of clusters of highly related HIV-1 sequences, particularly among recently HIV-infected individuals, which have been used to argue for a high transmission rate during acute infection. Using a large set of HIV-1 subtype B pol sequences collected from men who have sex with men, we demonstrate that virus from recent infections tend to be phylogenetically clustered at a greater rate than virus from patients with chronic infection ('excess clustering') and also tend to cluster with other recent HIV infections rather than chronic, established infections ('excess co-clustering'), consistent with previous reports. To determine the role that a higher infectivity during acute infection may play in excess clustering and co-clustering, we developed a simple model of HIV infection that incorporates an early period of intensified transmission, and explicitly considers the dynamics of phylogenetic clusters alongside the dynamics of acute and chronic infected cases. We explored the potential for clustering statistics to be used for inference of acute stage transmission rates and found that no single statistic explains very much variance in parameters controlling acute stage transmission rates. We demonstrate that high transmission rates during the acute stage is not the main cause of excess clustering of virus from patients with early/acute infection compared to chronic infection, which may simply reflect the shorter time since transmission in acute infection. Higher transmission during acute infection can result in excess co-clustering of sequences, while the extent of clustering observed is most sensitive to the fraction of infections sampled.
Conflict of interest statement
The authors have declared that no competing interests exist.
Figures

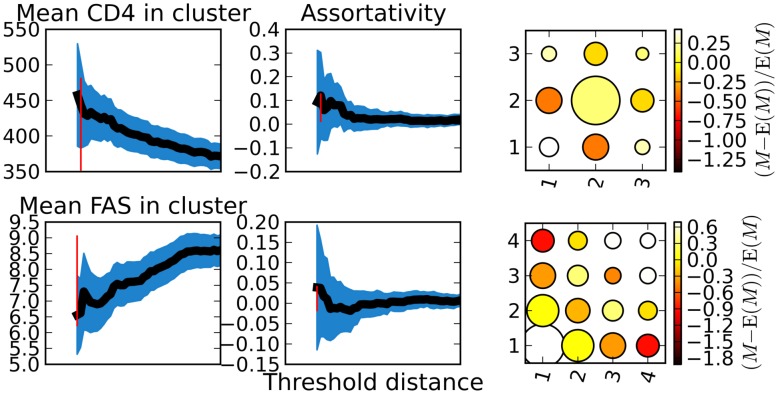
 ) or quartile of frequency of ambiguous sites (bottom). The color represents the extent to which the count of co-clusterings exceeds the expectation if clusters were forming at random. The color scale (far right) shows strong assortativity within quartiles. The vertical red bar represents the threshold which was used to create clusters and the matrix derived from the set of clusters. This threshold corresponds to the maximum of the assortativity coefficient for the derived matrix.
Similar articles
-
Phylogenetic Investigation of a Statewide HIV-1 Epidemic Reveals Ongoing and Active Transmission Networks Among Men Who Have Sex With Men.J Acquir Immune Defic Syndr. 2015 Dec 1;70(4):428-35. doi: 10.1097/QAI.0000000000000786. J Acquir Immune Defic Syndr. 2015. PMID: 26258569 Free PMC article.
-
Epidemiological study of phylogenetic transmission clusters in a local HIV-1 epidemic reveals distinct differences between subtype B and non-B infections.BMC Infect Dis. 2010 Sep 7;10:262. doi: 10.1186/1471-2334-10-262. BMC Infect Dis. 2010. PMID: 20822507 Free PMC article.
-
Subtype-specific differences in transmission cluster dynamics of HIV-1 B and CRF01_AE in New South Wales, Australia.J Int AIDS Soc. 2021 Jan;24(1):e25655. doi: 10.1002/jia2.25655. J Int AIDS Soc. 2021. PMID: 33474833 Free PMC article.
-
Insights on transmission of HIV from phylogenetic analysis to locally optimize HIV prevention strategies.Curr Opin HIV AIDS. 2018 Mar;13(2):95-101. doi: 10.1097/COH.0000000000000443. Curr Opin HIV AIDS. 2018. PMID: 29266012 Review.
-
HIV-1 subtype C predicted co-receptor tropism in Africa: an individual sequence level meta-analysis.AIDS Res Ther. 2020 Feb 7;17(1):5. doi: 10.1186/s12981-020-0263-x. AIDS Res Ther. 2020. PMID: 32033571 Free PMC article. Review.
Cited by
-
Identification of a cluster of HIV-1 controllers infected with low replicating viruses.PLoS One. 2013 Oct 30;8(10):e77663. doi: 10.1371/journal.pone.0077663. eCollection 2013. PLoS One. 2013. PMID: 24204910 Free PMC article.
-
Modelling tree shape and structure in viral phylodynamics.Philos Trans R Soc Lond B Biol Sci. 2013 Feb 4;368(1614):20120208. doi: 10.1098/rstb.2012.0208. Print 2013 Mar 19. Philos Trans R Soc Lond B Biol Sci. 2013. PMID: 23382430 Free PMC article.
-
Inferring the source of transmission with phylogenetic data.PLoS Comput Biol. 2013;9(12):e1003397. doi: 10.1371/journal.pcbi.1003397. Epub 2013 Dec 19. PLoS Comput Biol. 2013. PMID: 24367249 Free PMC article.
-
Transmission of Non-B HIV Subtypes in the United Kingdom Is Increasingly Driven by Large Non-Heterosexual Transmission Clusters.J Infect Dis. 2016 May 1;213(9):1410-8. doi: 10.1093/infdis/jiv758. Epub 2015 Dec 23. J Infect Dis. 2016. PMID: 26704616 Free PMC article.
-
HIV-1 transmission networks in a small world.J Infect Dis. 2014 Jan 15;209(2):180-2. doi: 10.1093/infdis/jit525. Epub 2013 Oct 22. J Infect Dis. 2014. PMID: 24151310 Free PMC article. No abstract available.
References
-
- Bruisten S, Schouls L. Molecular typing and clustering analysis as a tool for epidemiology of infectious diseases. Modern Infectious Disease Epidemiology: Concepts, Methods, Mathematical Models, and Public Health. 2010:117.
-
- Grenfell B, Pybus O, Gog J, Wood J, Daly J, et al. Unifying the epidemiological and evolutionary dynamics of pathogens. Science. 2004;303:327. - PubMed
-
- Zhu T, Mo H, Wang N, Nam D, Cao Y, et al. Genotypic and phenotypic characterization of HIV-1 patients with primary infection. Science. 1993;261:1179. - PubMed
Publication types
MeSH terms
Grants and funding
LinkOut - more resources
Full Text Sources
Medical
