

A model-based Bayesian estimation of the rate of evolution of VNTR loci in Mycobacterium tuberculosis
- PMID: 22761563
- PMCID: PMC3386166
- DOI: 10.1371/journal.pcbi.1002573
A model-based Bayesian estimation of the rate of evolution of VNTR loci in Mycobacterium tuberculosis
Abstract
Variable numbers of tandem repeats (VNTR) typing is widely used for studying the bacterial cause of tuberculosis. Knowledge of the rate of mutation of VNTR loci facilitates the study of the evolution and epidemiology of Mycobacterium tuberculosis. Previous studies have applied population genetic models to estimate the mutation rate, leading to estimates varying widely from around 10⁻⁵ to 10⁻² per locus per year. Resolving this issue using more detailed models and statistical methods would lead to improved inference in the molecular epidemiology of tuberculosis. Here, we use a model-based approach that incorporates two alternative forms of a stepwise mutation process for VNTR evolution within an epidemiological model of disease transmission. Using this model in a Bayesian framework we estimate the mutation rate of VNTR in M. tuberculosis from four published data sets of VNTR profiles from Albania, Iran, Morocco and Venezuela. In the first variant, the mutation rate increases linearly with respect to repeat numbers (linear model); in the second, the mutation rate is constant across repeat numbers (constant model). We find that under the constant model, the mean mutation rate per locus is 10⁻²·⁰⁶ (95% CI: 10⁻²·⁶¹,10⁻¹·⁵⁸)and under the linear model, the mean mutation rate per locus per repeat unit is 10⁻²·⁴⁵ (95% CI: 10⁻³·⁰⁷,10⁻¹·⁹⁴). These new estimates represent a high rate of mutation at VNTR loci compared to previous estimates. To compare the two models we use posterior predictive checks to ascertain which of the two models is better able to reproduce the observed data. From this procedure we find that the linear model performs better than the constant model. The general framework we use allows the possibility of extending the analysis to more complex models in the future.
Conflict of interest statement
The authors have declared that no competing interests exist.
Figures
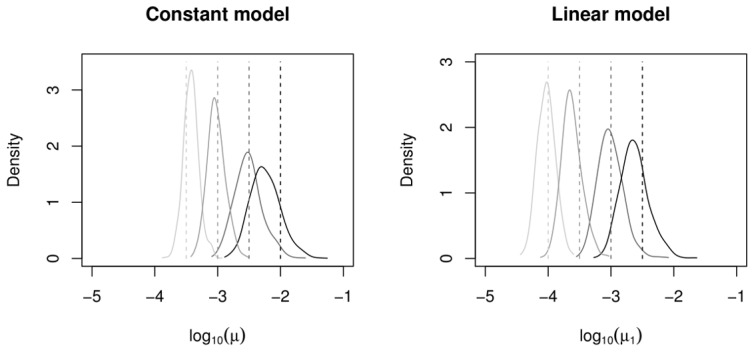
 (left) and
  (right) using four simulated data sets generated from the constant (left) and linear (right) VNTR models. The known values of
  and
and  used to generate the data,
  and
and  , are indicated by vertical lines.
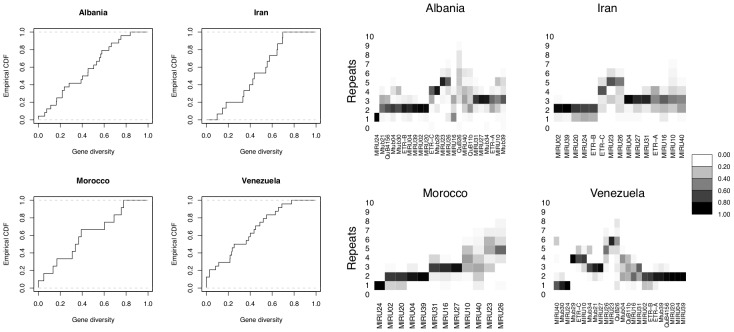
 where
where  is the number of isolates with repeat size
  at locus
  . Right plots: Heat-map diversity, following Aminian et al (2009), illustrating the proportion of tandem repeats for each locus (ordered according to the original study).
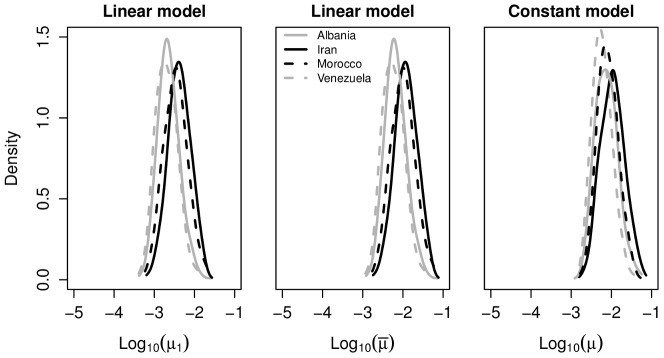
 is the per-locus mutation rate for a locus with a single repeat under the linear model;
  is the same quantity scaled by the mean number of repeats observed in the sample;
  is the per-locus mutation rate for any repeat number under the constant model.
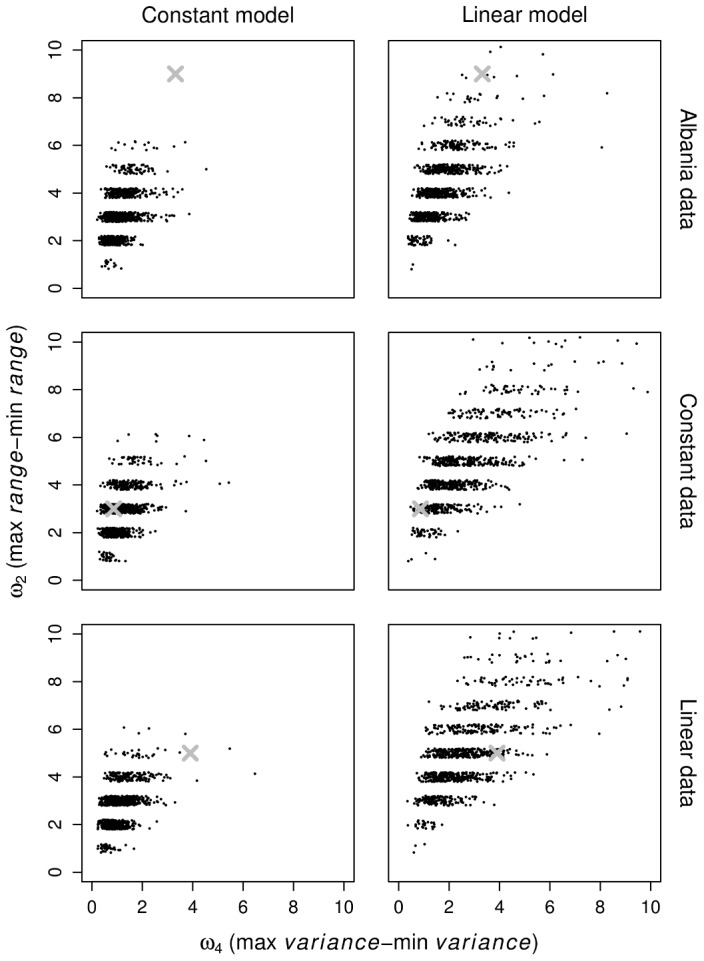
 (the difference between maximum and minimum range of repeat numbers over loci), versus
  (the same quantity substituting variance for range). Columns represent constant (left) and linear (right) models. Rows represent the Albanian dataset (top), artificially generated data from the constant model (middle) and artificially generated data from the linear model (bottom). The
  indicates the statistics derived from the observed dataset.
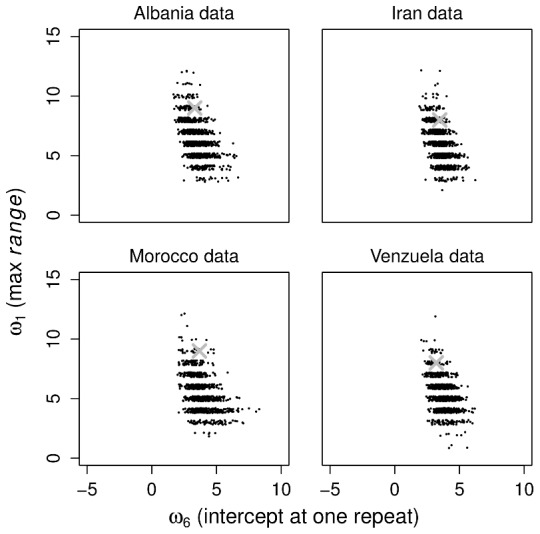
 (the maximum range of repeat numbers over loci) versus
  (the intercept at one repeat) under the linear model, for each observed dataset. The
  indicates the statistics derived from the observed dataset.
References
-
- World Health Organization. Global tuberculosis control 2010. World Health Organization; 2010.
Publication types
MeSH terms
Substances
LinkOut - more resources
Full Text Sources
