

From dynamic expression patterns to boundary formation in the presomitic mesoderm
- PMID: 22761566
- PMCID: PMC3386180
- DOI: 10.1371/journal.pcbi.1002586
From dynamic expression patterns to boundary formation in the presomitic mesoderm
Erratum in
-
Correction: From Dynamic Expression Patterns to Boundary Formation in the Presomitic Mesoderm.PLoS Comput Biol. 2019 Jul 2;15(7):e1007191. doi: 10.1371/journal.pcbi.1007191. eCollection 2019 Jul. PLoS Comput Biol. 2019. PMID: 31265460 Free PMC article.
Abstract
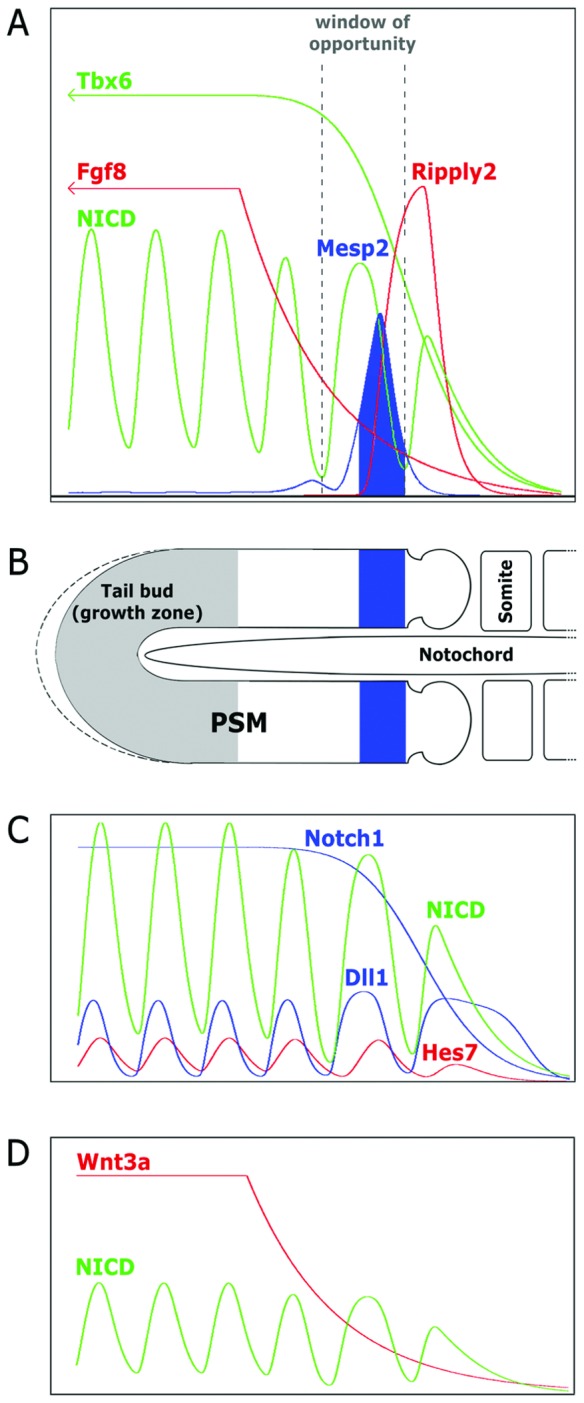
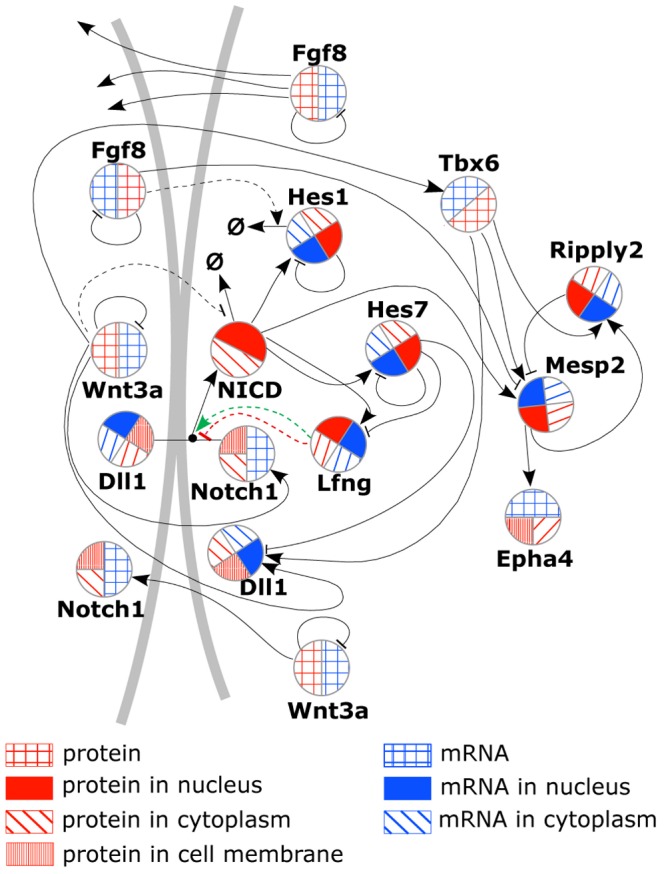
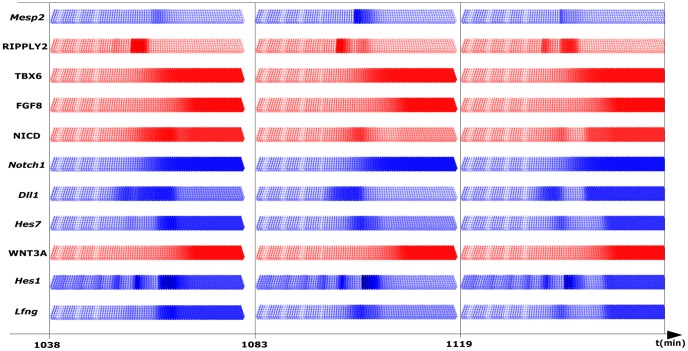
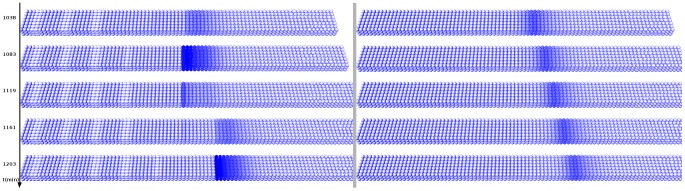
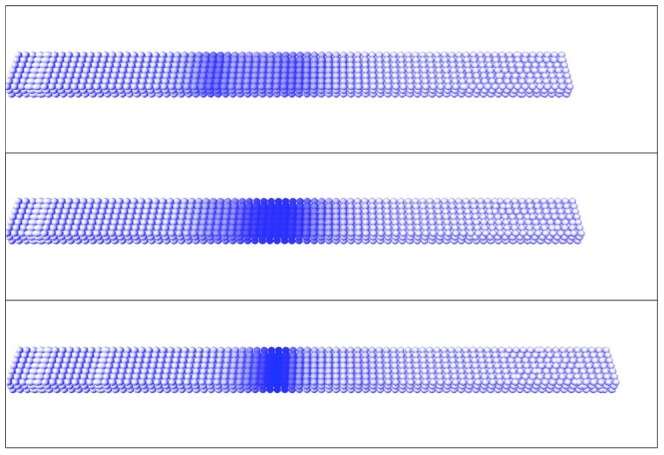
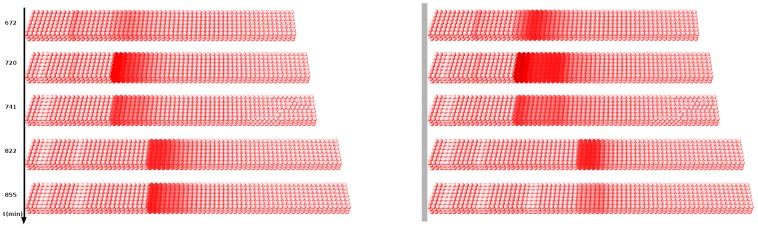
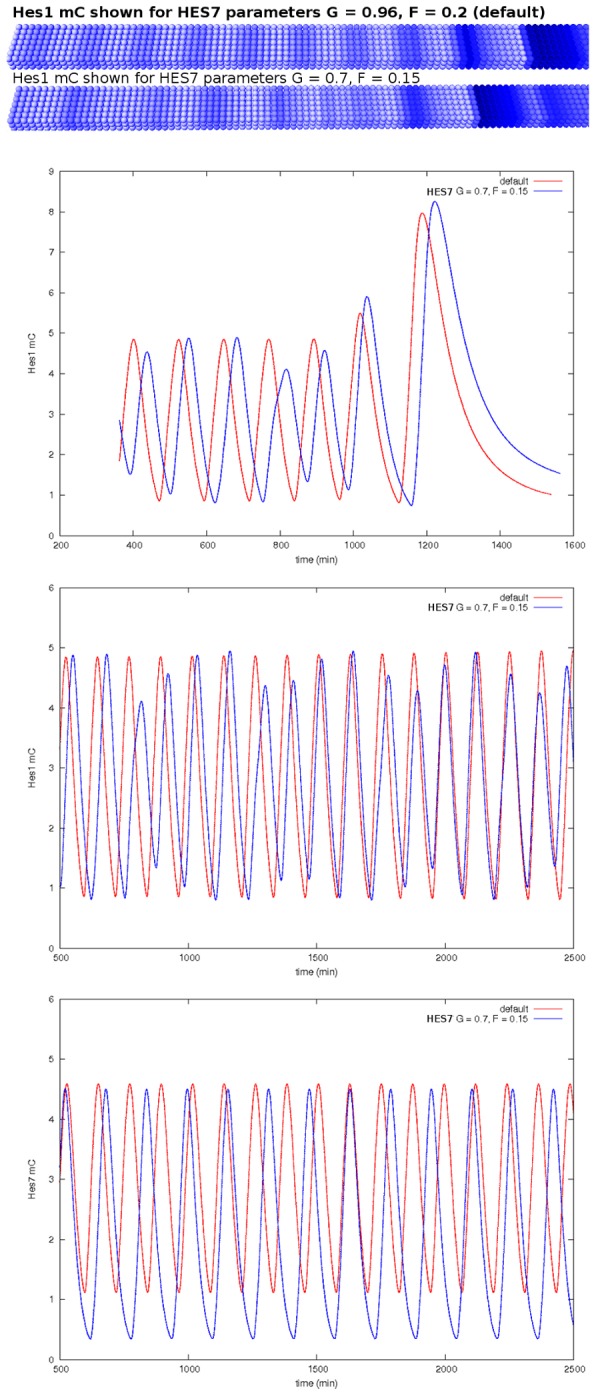
The segmentation of the vertebrate body is laid down during early embryogenesis. The formation of signaling gradients, the periodic expression of genes of the Notch-, Fgf- and Wnt-pathways and their interplay in the unsegmented presomitic mesoderm (PSM) precedes the rhythmic budding of nascent somites at its anterior end, which later develops into epithelialized structures, the somites. Although many in silico models describing partial aspects of somitogenesis already exist, simulations of a complete causal chain from gene expression in the growth zone via the interaction of multiple cells to segmentation are rare. Here, we present an enhanced gene regulatory network (GRN) for mice in a simulation program that models the growing PSM by many virtual cells and integrates WNT3A and FGF8 gradient formation, periodic gene expression and Delta/Notch signaling. Assuming Hes7 as core of the somitogenesis clock and LFNG as modulator, we postulate a negative feedback of HES7 on Dll1 leading to an oscillating Dll1 expression as seen in vivo. Furthermore, we are able to simulate the experimentally observed wave of activated NOTCH (NICD) as a result of the interactions in the GRN. We esteem our model as robust for a wide range of parameter values with the Hes7 mRNA and protein decays exerting a strong influence on the core oscillator. Moreover, our model predicts interference between Hes1 and HES7 oscillators when their intrinsic frequencies differ. In conclusion, we have built a comprehensive model of somitogenesis with HES7 as core oscillator that is able to reproduce many experimentally observed data in mice.
Conflict of interest statement
The authors have declared that no competing interests exist.
Figures
Similar articles
-
Hopf bifurcation in the presomitic mesoderm during the mouse segmentation.J Theor Biol. 2009 Jul 7;259(1):176-89. doi: 10.1016/j.jtbi.2009.02.007. Epub 2009 Feb 21. J Theor Biol. 2009. PMID: 19236883
-
Notch is a critical component of the mouse somitogenesis oscillator and is essential for the formation of the somites.PLoS Genet. 2009 Sep;5(9):e1000662. doi: 10.1371/journal.pgen.1000662. Epub 2009 Sep 25. PLoS Genet. 2009. PMID: 19779553 Free PMC article.
-
A multi-cell, multi-scale model of vertebrate segmentation and somite formation.PLoS Comput Biol. 2011 Oct;7(10):e1002155. doi: 10.1371/journal.pcbi.1002155. Epub 2011 Oct 6. PLoS Comput Biol. 2011. PMID: 21998560 Free PMC article. Review.
-
Dynamic Delta-like1 expression in presomitic mesoderm cells during somite segmentation.Gene Expr Patterns. 2020 Jan;35:119094. doi: 10.1016/j.gep.2019.119094. Epub 2019 Dec 31. Gene Expr Patterns. 2020. PMID: 31899345
-
Oscillatory gene expression and somitogenesis.Wiley Interdiscip Rev Dev Biol. 2012 Sep-Oct;1(5):629-41. doi: 10.1002/wdev.46. Epub 2012 Mar 22. Wiley Interdiscip Rev Dev Biol. 2012. PMID: 23799565 Review.
Cited by
-
Circadian genes, xBmal1 and xNocturnin, modulate the timing and differentiation of somites in Xenopus laevis.PLoS One. 2014 Sep 19;9(9):e108266. doi: 10.1371/journal.pone.0108266. eCollection 2014. PLoS One. 2014. PMID: 25238599 Free PMC article.
-
Rapid Identification of the SNP Mutation in the ABCD4 Gene and Its Association with Multi-Vertebrae Phenotypes in Ujimqin Sheep Using TaqMan-MGB Technology.Animals (Basel). 2025 Aug 5;15(15):2284. doi: 10.3390/ani15152284. Animals (Basel). 2025. PMID: 40805073 Free PMC article.
-
The precise timeline of transcriptional regulation reveals causation in mouse somitogenesis network.BMC Dev Biol. 2013 Dec 5;13:42. doi: 10.1186/1471-213X-13-42. BMC Dev Biol. 2013. PMID: 24304493 Free PMC article.
-
Sequential pattern formation governed by signaling gradients.Phys Biol. 2016 Oct 11;13(5):05LT03. doi: 10.1088/1478-3975/13/5/05LT03. Phys Biol. 2016. PMID: 27727151 Free PMC article.
-
Time and space in segmentation.Interface Focus. 2021 Apr 16;11(3):20200049. doi: 10.1098/rsfs.2020.0049. eCollection 2021 Jun 6. Interface Focus. 2021. PMID: 34055302 Free PMC article.
References
-
- Gomez C, Ozbudak EM, Wunderlich J, Baumann D, Lewis J, et al. Control of segment number in vertebrate embryos. Nature. 2008;454:335–339. - PubMed
-
- Saga Y, Takeda H. The making of the somite: molecular events in vertebrate segmentation. Nat Rev Genet. 2001;2:835–845. - PubMed
-
- Fortini ME. Notch signaling: the core pathway and its posttranslational regulation. Dev Cell. 2009;16:633–647. - PubMed
-
- Morimoto M, Takahashi Y, Endo M, Saga Y. The Mesp2 transcription factor establishes segmental borders by suppressing Notch activity. Nature. 2005;435:354–359. - PubMed
Publication types
MeSH terms
Substances
LinkOut - more resources
Full Text Sources
Miscellaneous
