. 2012 Jun;8(6):e1002789.
doi: 10.1371/journal.pgen.1002789. Epub 2012 Jun 28.

Extensive evolutionary changes in regulatory element activity during human origins are associated with altered gene expression and positive selection

Affiliations

Extensive evolutionary changes in regulatory element activity during human origins are associated with altered gene expression and positive selection

Yoichiro Shibata et al. PLoS Genet. 2012 Jun.

Abstract

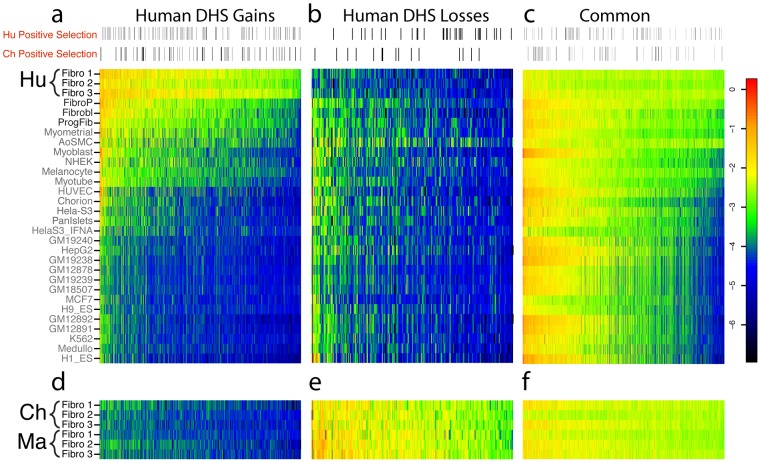
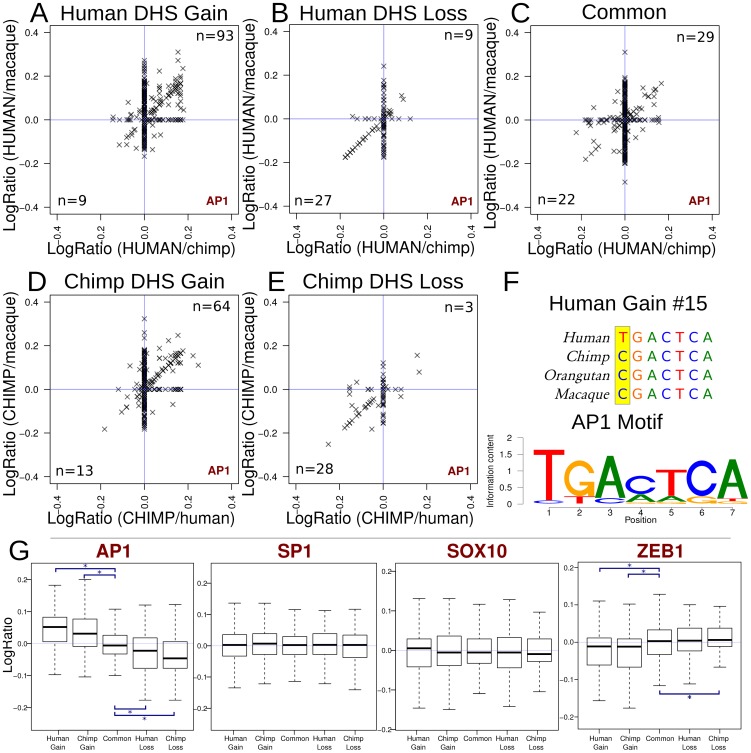
Understanding the molecular basis for phenotypic differences between humans and other primates remains an outstanding challenge. Mutations in non-coding regulatory DNA that alter gene expression have been hypothesized as a key driver of these phenotypic differences. This has been supported by differential gene expression analyses in general, but not by the identification of specific regulatory elements responsible for changes in transcription and phenotype. To identify the genetic source of regulatory differences, we mapped DNaseI hypersensitive (DHS) sites, which mark all types of active gene regulatory elements, genome-wide in the same cell type isolated from human, chimpanzee, and macaque. Most DHS sites were conserved among all three species, as expected based on their central role in regulating transcription. However, we found evidence that several hundred DHS sites were gained or lost on the lineages leading to modern human and chimpanzee. Species-specific DHS site gains are enriched near differentially expressed genes, are positively correlated with increased transcription, show evidence of branch-specific positive selection, and overlap with active chromatin marks. Species-specific sequence differences in transcription factor motifs found within these DHS sites are linked with species-specific changes in chromatin accessibility. Together, these indicate that the regulatory elements identified here are genetic contributors to transcriptional and phenotypic differences among primate species.


Conflict of interest statement

The authors have declared that no competing interests exist.

Figures

Figure 1
Figure 1. Comparison of DHS sites and DGE-seq data across species.
(a) Analysis pipeline. DNase-sequences from each species were aligned to the native genome and lifted over to the human genome for analysis. Regions are filtered at various steps of the analysis to remove alignment and orthology artifacts (Materials and Materials). Correlation plots of DNase-seq signals (b) and DGE-seq signals (c) expression data show that both chromatin and expression data from human (Hu), chimpanzee (Ch), and macaque (Ma) are more highly correlated between biological replicates from the same tissue within a single species. Additionally, the same cell type from different species is more similar than different cell types from the same species.
Figure 2
Figure 2. Identification of species-specific differences in DHS sites.
Species-specific DHS sites were identified by edgeR (Materials and Methods). Boxplots show the distribution of number of reads per sample in 300 bp windows. For human DHS gains (a), the 3 human samples are all significantly more open than the other 2 species. Likewise, human DHS losses (b) show lower signal in human compared to both chimpanzee and macaque. A representative sampling of distributions from all DHS is shown in (c), as well as Common DHS sites (d) found in all three species that are matched for signal intensity compared to human DHS gains and human DHS losses. (e) Distribution of species-specific DHS Gains and DHS Losses relative to promoters, introns, 3′ UTR, and intergenic regions. (f) Representative screen shots of human-specific DHS Gains and Losses compared to a Common region.
Figure 3
Figure 3. Comparison of species-specific DHS to independently derived cells.
Human DHS gains show a high level of overlap to DHS regions identified in (a) three independently analyzed human fibroblast cell lines and (b) 5 independently analyzed human LCL samples, compared to human DHS losses. Common DHS are also similarly detected.
Figure 4
Figure 4. Comparison of human DHS site gains and losses to DNase-seq data from other human cell types.
The log of the DNase-seq signal intensity value, defined as the maximum parzen score (output of F-seq) for each of the coordinates that are represented along the x-axis, are represented as a heatmap in these figures. The color red represents a higher score, and thus a relatively higher DNase-seq signal, and the color blue represents a lower score. (a) 836 DHS sites were identified as differentially open (human DHS gain) in human fibroblasts compared to chimpanzee/macaque fibroblasts. These regions from Human Fibroblasts (Hu Fibro 1–3) were compared to DNase-seq data generated from 27 other human cell types (Table S3). Additional human skin fibroblast samples (listed in black) are highly similar, while some non-fibroblast cell types show less but substantial overlap and the remaining cell types show much less overlap. Only a small fraction of DHS sites were active in all 27 cell lines (Figure S5). Sites with evidence for positive selection are indicated in the horizontal bar above the heatmap. The distribution appears roughly uniform. (b) 286 DHS sites identified as differentially closed (human DHS loss) compared to chimp and macaque fibroblasts. (c) DNase-seq signal values for Common regions representing DHS sites in all three species. More than 50% of Common regions are also DHS sites in other human tissues. (d, e, f) DNase-seq values for same regions as (a, b, c), but DNase data is from orthologous region from chimpanzee and macaque fibroblasts.
Figure 5
Figure 5. Species-specific DHS sites are associated with functional chromatin marks.
DHS sites detected only in human, but not chimpanzee, LCLs are more enriched for ChIP signals in matched human cell types. LCL histone modification and CTCF ChIP-seq data were previously generated from the GM12878 cell line . Fisher's exact test P value significance levels indicated by asterisks or NS (not significant) are provide for LCL human DHS gains compared to LCL human DHS loss and LCL common DHS regions (Table S6).
Figure 6
Figure 6. Species-specific DHS sites are correlated with expression and evolutionary selection.
(a) 58 human DHS gains (yellow arrow) overlapped human upregulated genes (HumanExpUp), a highly significant enrichment compared to 100,000 random permutations (P = 0.00039). Only 17 human DHS gains (blue arrow) overlapped human downregulated genes (HumanExpDown), which is lower than random permutations (P = 0.008) (b) Comparison of DHS gains and losses with expression gains and losses. Yellow represents DHS and expression matches that occur more often than random permutations, while blue represent less often. P value indicated in each box. (c) Percentage of regions that display evidence of positive selection on the human (purple) or chimpanzee (brown) branch. Both human-specific DHS site gains and losses show more evidence of positive selection on the human branch, while chimpanzee-specific DHS site gains and losses show more evidence of positive selection on the chimpanzee branch (*P<0.03, ** P<0.002). Common sites show an equivalent amount of selection on both branches. (d) Percentage overlap of DHS Gains (combined from both human and chimpanzee), DHS Losses, and Common DHS sites compared to evolutionarily constrained regions generated using GSC (Materials and Methods). Regions were divided into three compartments: promoter, intron, and intergenic regions. The black dot represents the null expectation of finding a constrained region and error bars represent one standard deviation.
Figure 7
Figure 7. Functional mutations associated with DHS gains and losses.
(a–e) Scatterplots showing the enrichment of AP1 motif matches in species with increased hypersensitivity. Each “x” represents a single DHS site. (a–c) positive values on each axis indicate better motif matches on the human branch. For these regions, points in the upper-right quadrant are regions where the AP1 motif scores better in human than either chimp or macaque, where the lower left represent AP1 motif scores worse in human. The number of DHS sites in these quadrants are indicated. (d–e) For chimp gain and loss regions, positive values for each axis indicate a better motif match in the chimp branch. (f) The AP1 motif from JASPAR and an example alignment of a representative human gain region representing a point along the diagonal in the upper-right quadrant in panel a. (g) Boxplots summarizing the results from AP1 and three other motifs. The boxplots show the distribution of (combined) log-ratios (relative to the appropriate species). P values for differences relative to common regions are significant (asterisk) in all 4 comparisons: human DHS gains, P<10−31; human DHS losses P<10−3; chimp DHS gains, P<10−13; chimp DHS losses, P<10−8 (Materials and Methods). In AP1, the significant trends illustrate the same principal observed in panels a–e. Most other transcription factors have plots that show no pattern in motif score among species, such as SP1 and SOX10 (Supplemental data file 3 in Dataset S1). ZEB1, a transcriptional repressor, displays an inverse relationship with hypersensitivity.

References

    1. Robertson M. The evolution of gene regulation, the RNA universe, and the vexed questions of artefact and noise. BMC Biol. 2010;8:97. - PMC - PubMed
    1. Olson MV, Varki A. Sequencing the chimpanzee genome: insights into human evolution and disease. Nat Rev Genet. 2003;4:20–28. - PubMed
    1. Sholtis SJ, Noonan JP. Gene regulation and the origins of human biological uniqueness. Trends Genet. 2010;26:110–118. - PubMed
    1. King MC, Wilson AC. Evolution at two levels in humans and chimpanzees. Science. 1975;188:107–116. - PubMed
    1. Caceres M, Lachuer J, Zapala MA, Redmond JC, Kudo L, et al. Elevated gene expression levels distinguish human from non-human primate brains. Proc Natl Acad Sci U S A. 2003;100:13030–13035. - PMC - PubMed

Publication types