

Modeling collective animal behavior with a cognitive perspective: a methodological framework
- PMID: 22761685
- PMCID: PMC3383699
- DOI: 10.1371/journal.pone.0038588
Modeling collective animal behavior with a cognitive perspective: a methodological framework
Abstract
The last decades have seen an increasing interest in modeling collective animal behavior. Some studies try to reproduce as accurately as possible the collective dynamics and patterns observed in several animal groups with biologically plausible, individual behavioral rules. The objective is then essentially to demonstrate that the observed collective features may be the result of self-organizing processes involving quite simple individual behaviors. Other studies concentrate on the objective of establishing or enriching links between collective behavior researches and cognitive or physiological ones, which then requires that each individual rule be carefully validated. Here we discuss the methodological consequences of this additional requirement. Using the example of corpse clustering in ants, we first illustrate that it may be impossible to discriminate among alternative individual rules by considering only observational data collected at the group level. Six individual behavioral models are described: They are clearly distinct in terms of individual behaviors, they all reproduce satisfactorily the collective dynamics and distribution patterns observed in experiments, and we show theoretically that it is strictly impossible to discriminate two of these models even in the limit of an infinite amount of data whatever the accuracy level. A set of methodological steps are then listed and discussed as practical ways to partially overcome this problem. They involve complementary experimental protocols specifically designed to address the behavioral rules successively, conserving group-level data for the overall model validation. In this context, we highlight the importance of maintaining a sharp distinction between model enunciation, with explicit references to validated biological concepts, and formal translation of these concepts in terms of quantitative state variables and fittable functional dependences. Illustrative examples are provided of the benefits expected during the often long and difficult process of refining a behavioral model, designing adapted experimental protocols and inversing model parameters.
Conflict of interest statement
Figures

 s.d.) for the low and the high density experiments, respectively. Piles are defined as follows: Two neighboring objects are considered to belong to the same cluster if the distance between them is less than 1 mm. A cluster constitutes a pile if it contains at least 6 objects. In another circular arena with a 25 cm diameter was also used (with the same low and high initial densities). For the purpose of the methodological illustration in the first part of the results section only the large arena is used, but the model built in the second part of the results section is compatible with all observations, including the ones in small arenas (see Fig. 6).
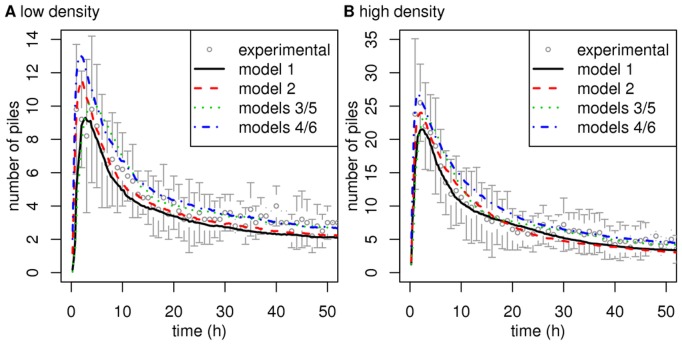
 s.d.) in the low and high density settings, respectively. The predictions of all the models are compatible with the experimental observations. Moreover, the predictions of model 5 are rigorously identical to those of model 3, and the predictions of model 6 are identical to those of model 4.
 and distance
  to the border of the arena. The dashed grey area represents the fractions of the objects perceived by the ant (which corresponds to
  in the text). When defining the perception stimulus at perimetric abscissa
  , without knowing the distance to the border
  (one-dimensional modeling),
  is defined as the average of all values of
  when
when  is uniformly distributed between
  and the distance
  of the external side of the farthest clustered object.
 trajectories) is compatible with an exponential fit
  , validating the memoryless and instantaneous turn assumptions and leading to the direction change frequency
  (mean
(mean  s.e.),
  ,
,  ,
,  . B) The survival curve of the proportion of ants still not having deposited the object they loaded at time
  in the empty arena (
 trajectories) is also compatible with an exponential fit
  and leads to the deposition frequency
  ,
,  ,
,  ,
,  . The black line represents the exponential fit and the dashed lines the 95% confidence interval. The
  -values correspond to a chi-squared test for goodness of fit as described in (pp. 131–137).
 s.e.) on clusters of several sizes. The plain curve in A corresponds to the formal dependence retained in (
 , with
  and
and  ,
,  ,
,  ,
,  ). The dashed curve is a linear fit (
 with
with  ,
,  ,
,  ,
,  ), very close to the previous formal dependence for small values of the perception stimulus. C) An alternative functional dependence of the deposition frequency on the perception stimulus, in which the deposition frequency is very low for small values of the perception stimulus and constant for values higher than a threshold corresponding to two objects entirely in the perception area. D) Adjustment of C to the experimental deposition probabilities (
 if
if  and
and  else, with
  ,
,  and
and  ,
,  ,
,  ,
,  ). The grey circles correspond to the experimental data (mean
  s.e.) and the
  -values to a weighted least squares procedure.
 s.d.) and the plain curves to the model predictions. The fitted number of ants in the arena is 50.
 of models 5 or 6 (also to be interpreted as the population average of the survival probabilities of models 3 or 4) compared to an exponential fit corresponding to small
  values (short time depositions). The extinction coefficient of the exponential is
  .
.Similar articles
-
The interplay between a self-organized process and an environmental template: corpse clustering under the influence of air currents in ants.J R Soc Interface. 2007 Feb 22;4(12):107-16. doi: 10.1098/rsif.2006.0156. J R Soc Interface. 2007. PMID: 17015288 Free PMC article.
-
Probabilistic models of individual and collective animal behavior.PLoS One. 2018 Mar 7;13(3):e0193049. doi: 10.1371/journal.pone.0193049. eCollection 2018. PLoS One. 2018. PMID: 29513700 Free PMC article.
-
How ants move: individual and collective scaling properties.J R Soc Interface. 2018 Jun;15(143):20180223. doi: 10.1098/rsif.2018.0223. J R Soc Interface. 2018. PMID: 29899161 Free PMC article.
-
Collective cognition in animal groups.Trends Cogn Sci. 2009 Jan;13(1):36-43. doi: 10.1016/j.tics.2008.10.002. Epub 2008 Dec 6. Trends Cogn Sci. 2009. PMID: 19058992 Review.
-
Ant traffic rules.J Exp Biol. 2010 Jul 15;213(Pt 14):2357-63. doi: 10.1242/jeb.031237. J Exp Biol. 2010. PMID: 20581264 Review.
Cited by
-
Reconsidering the importance of the past in predator-prey models: both numerical and functional responses depend on delayed prey densities.Proc Biol Sci. 2013 Aug 7;280(1768):20131389. doi: 10.1098/rspb.2013.1389. Print 2013 Oct 7. Proc Biol Sci. 2013. PMID: 23926152 Free PMC article.
-
The visual coupling between neighbours explains local interactions underlying human 'flocking'.Proc Biol Sci. 2022 Mar 9;289(1970):20212089. doi: 10.1098/rspb.2021.2089. Epub 2022 Mar 2. Proc Biol Sci. 2022. PMID: 35232235 Free PMC article.
-
Modeling bee movement shows how a perceptual masking effect can influence flower discovery.PLoS Comput Biol. 2023 Mar 24;19(3):e1010558. doi: 10.1371/journal.pcbi.1010558. eCollection 2023 Mar. PLoS Comput Biol. 2023. PMID: 36961828 Free PMC article.
-
Away from the herd: loneliness as a dysfunction of social alignment.Soc Cogn Affect Neurosci. 2024 Feb 16;19(1):nsae005. doi: 10.1093/scan/nsae005. Soc Cogn Affect Neurosci. 2024. PMID: 38287695 Free PMC article.
-
Tuning social interactions' strength drives collective response to light intensity in schooling fish.PLoS Comput Biol. 2023 Nov 17;19(11):e1011636. doi: 10.1371/journal.pcbi.1011636. eCollection 2023 Nov. PLoS Comput Biol. 2023. PMID: 37976299 Free PMC article.
References
-
- Camazine S, Deneubourg JL, Franks NR, Sneyd J, Theraulaz G, et al. Self-organization in biological systems. Princeton, NJ: Princeton University Press. 2001.
-
- Couzin I, Krause J. Self-organization and collective behavior in vertebrates. Advances in the Study of Behavior. 2003;32:1–75.
-
- Sumpter D. Collective animal behavior. Princeton, NJ: Princeton Univ Press. 2010.
-
- Ben-Jacob E. Bacterial self–organization: co–enhancement of complexification and adaptability in a dynamic environment. Philosophical Transactions of the Royal Society of London Series A: Mathematical, Physical and Engineering Sciences. 2003;361:1283–1312. - PubMed
-
- Emlen Jr J. Flocking behavior in birds. The Auk. 1952;69:160–170.
Publication types
MeSH terms
LinkOut - more resources
Full Text Sources
